
- Home >
- Stock Photos >
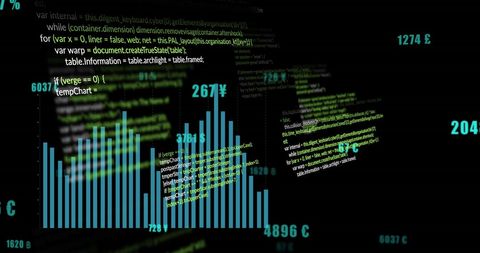
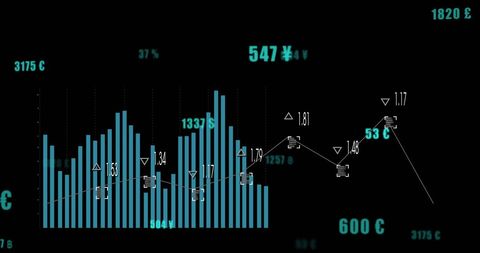
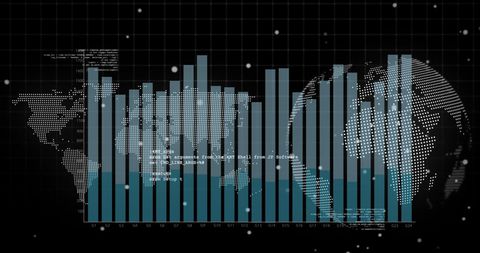
- Abstract Financial Data Visualization on Black Background
Abstract Financial Data Visualization on Black Background Image

This abstract representation of financial data illustrated through a bar chart offers a modern touch for business presentations, financial reports, and investment analysis brochures. It conveys themes of economics, technology, and forward-looking strategies, serving as a perfect background or focal point for contexts focused on data processing and strategic financial insights.
Powered by 


downloads
Tags:
More
Credit Photo
If you would like to credit the Photo, here are some ways you can do so
Text Link
photo Link
<span class="text-link">
<span>
<a target="_blank" href=https://pikwizard.com/photo/abstract-financial-data-visualization-on-black-background/5264165af1e46224aecd536f4cd14866/>PikWizard</a>
</span>
</span>
<span class="image-link">
<span
style="margin: 0 0 20px 0; display: inline-block; vertical-align: middle; width: 100%;"
>
<a
target="_blank"
href="https://pikwizard.com/photo/abstract-financial-data-visualization-on-black-background/5264165af1e46224aecd536f4cd14866/"
style="text-decoration: none; font-size: 10px; margin: 0;"
>
<img src="https://pikwizard.com/pw/medium/5264165af1e46224aecd536f4cd14866.jpg" style="margin: 0; width: 100%;" alt="" />
<p style="font-size: 12px; margin: 0;">PikWizard</p>
</a>
</span>
</span>
Free (free of charge)
Free for personal and commercial use.
Author: Awesome Content
Similar Free Stock Images

Premium


Premium


Premium


Premium


Premium

Premium

Premium

Premium


Premium


Premium

Premium


Premium


Premium

Premium

Premium


Premium


Premium


Premium


Premium


Premium


Premium


Premium

Premium

Premium


Premium

Explore More Free Stock Images