- Home >
- Stock Photos >
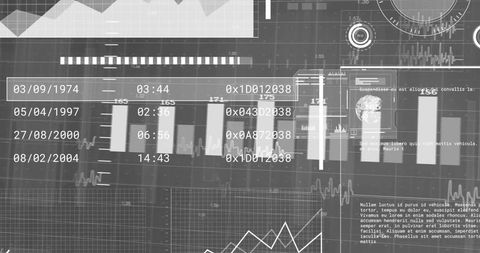
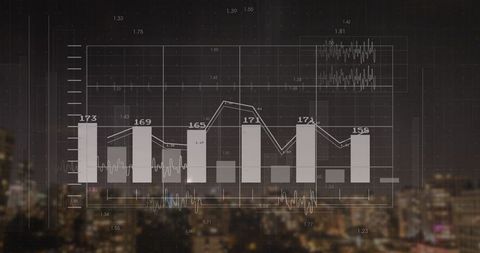
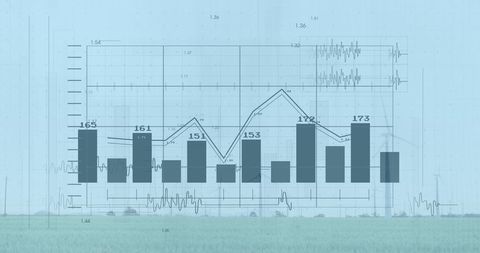
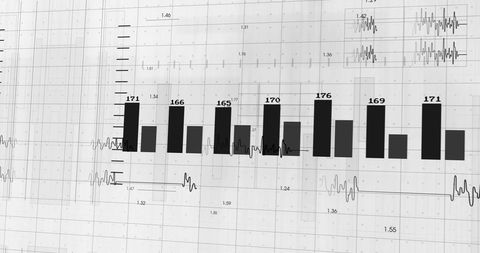
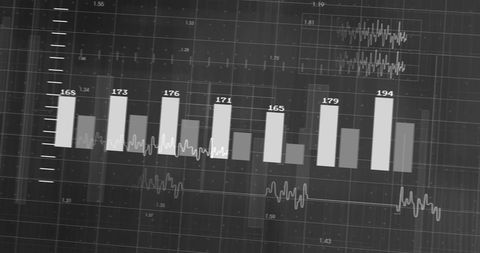
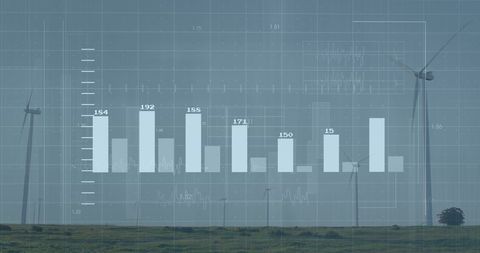
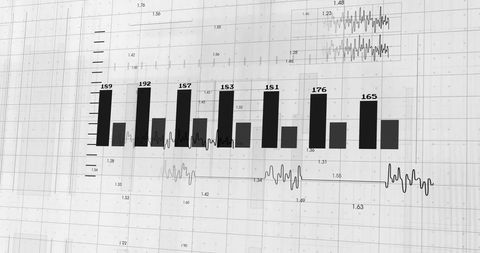
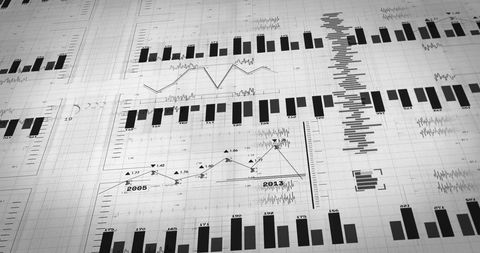
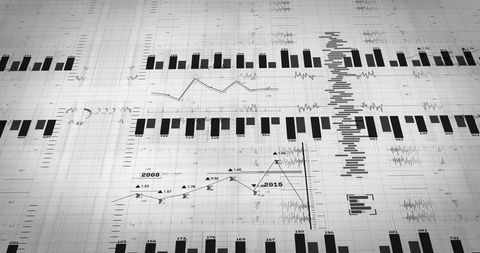
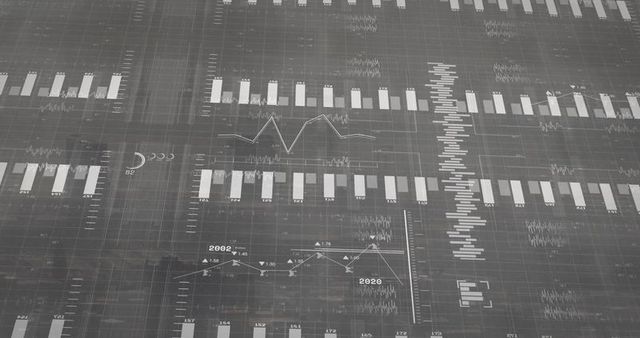
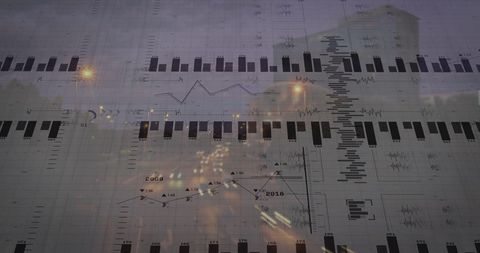
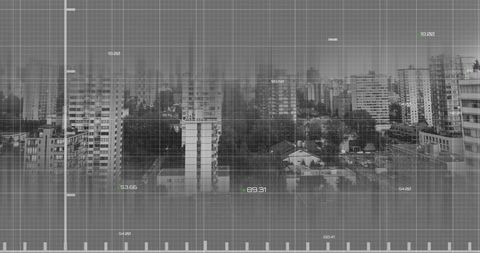
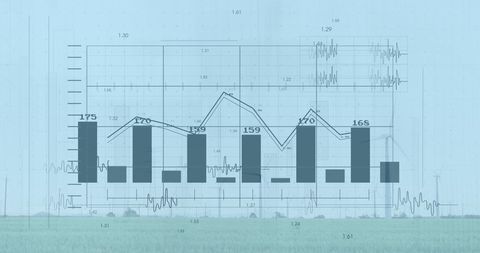
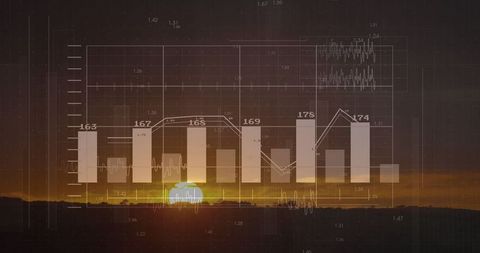
- Abstract Financial Data Visualization on Digital Interface
Abstract Financial Data Visualization on Digital Interface Image

Displays a dynamic interaction of vertical data bars with a line graph analysis on a dark grid background. Offers abstract perspective on financial markets, analytics, or technology platforms. Useful for materials involving tech dashboards, data-driven applications, finance sectors, or futuristic presentations.

downloads
Tags:
More
Credit Photo
If you would like to credit the Photo, here are some ways you can do so
Text Link
photo Link
<span class="text-link">
<span>
<a target="_blank" href=https://pikwizard.com/photo/abstract-financial-data-visualization-on-digital-interface/e08d76079d91d4d52a5a5277caf96da5/>PikWizard</a>
</span>
</span>
<span class="image-link">
<span
style="margin: 0 0 20px 0; display: inline-block; vertical-align: middle; width: 100%;"
>
<a
target="_blank"
href="https://pikwizard.com/photo/abstract-financial-data-visualization-on-digital-interface/e08d76079d91d4d52a5a5277caf96da5/"
style="text-decoration: none; font-size: 10px; margin: 0;"
>
<img src="https://pikwizard.com/pw/medium/e08d76079d91d4d52a5a5277caf96da5.jpg" style="margin: 0; width: 100%;" alt="" />
<p style="font-size: 12px; margin: 0;">PikWizard</p>
</a>
</span>
</span>
Free (free of charge)
Free for personal and commercial use.
Author: Creative Art