1. Home > 
  2. Stock Photos > 
  3. Abstract Financial Data Visualization on Purple Grid

Abstract Financial Data Visualization on Purple Grid Image

Abstract Financial Data Visualization on Purple Grid

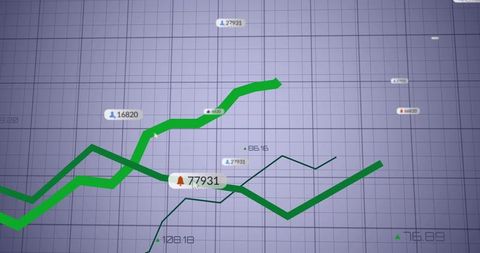
Abstract visualization of financial data featuring dynamic graphs and numbers on a purple grid background. Perfect for illustrating concepts in global finance, data processing, and business analytics. Suitable for use in sales reports, economic presentations, and educational material on financial statistics.

Powered by Shutterstock logo - Get 15% off with code: PIKWIZARD15
Big data analytics with AI technology. Data analyst analyzing and visualizing complex information network with artificial intelligence. Machine learning algorithm for business analytics and finance. - Powered by Shutterstock - Get 15% off with code: PIKWIZARD15Big data technology and data science. Data scientist querying, analysing and visualizing complex set on virtual screen. Data flow concept. Neural network, artificial intelligence, ML, analytics. - Powered by Shutterstock - Get 15% off with code: PIKWIZARD15Interactive Financial Data Visualization and Analytics. - Powered by Shutterstock - Get 15% off with code: PIKWIZARD15Analyst working with Business Analytics and Data Management System on computer to make report with KPI and metrics connected to database. Corporate strategy for finance, operations, sales, marketing - Powered by Shutterstock - Get 15% off with code: PIKWIZARD15Interactive Financial Data Visualization and Analytics. - Powered by Shutterstock - Get 15% off with code: PIKWIZARD15

Credit Photo

If you would like to credit the Photo, here are some ways you can do so

Free (free of charge)

Free for personal and commercial use.

Author: Creative Art

Similar Free Stock Images

Rising Green Line on Financial Digital Display
Premium
An image depicting an analytical view of financial data with graphs and numbers on laptop and smartphone screens
Dynamic Chart and Globe Depict Global Financial Movement
Abstract Digital Interface with Rising Data Graph
Financial Market Decline Illustrated on Grid Chart
Futuristic Data Graph Overlay on Urban Cityscape
Premium
Strategizing Wealth Management: Close-up of Hands Holding Financial Data amidst Office Desktop Dynamics
Digital Graph Overlay in Warehouse Environment Background
Economic Data Visualization of Chad Flag Colors
Digital Data Visualization with Dynamic Graph and Global Interface
Data Trends Visualization Over Virus Background
Premium
business analytics and financial technology concept, 3d chart from the screen of digital tablet computer
Dynamic Green Line Graph on Data Grid Background
Declining Financial Chart with Red Lines on Data Grid
Graph Visualizing Economic Downtrend and Financial Data
Financial Crisis Concept with Declining Graph on Digital Grid
Premium
Analyzing Key Performance Indicators. Businessman using digital screen to analyze key performance indicators (KPI) with various graphs and charts, showcasing data analysis and performance tracking.
Declining Graph Illustrating Business Loss and Reduction Concept
Dynamic Stock Market Growth and Analysis Concept
Global Financial Downturn Over Map with Red Graph Line
Declining Financial Graph on Grid Background
Premium
Futuristic Digital Growth Chart – 3D Bar Graph with Glowing Blue Data Visualization
Dynamic Data Visualization with Green Graph Lines on White Background
Digital Stock Market Data on Red Background
Dynamic Growth Over Time on Grid Background
Digital Interface with Declining Graph Overlay in Office Environment
Premium
Woman hold smartphone use pc at workplace. Project stats financial data sales charts on laptop and cellphone screen, close up view over shoulder. Report preparation, synchronization for safety concept
Red Line Graph Representing Financial Downturn on Dark Grid Background
Digital Green Graph Lines on Grid Showing Business Analytics
Digital Financial Data Overlay Virtual Financial Interface
Digital Dashboard with Green Trend Line and Data Visualization Indicators
Dynamic Data Trends on Digital Display for Financial Analysis
Abstract Financial Data Visualization with Dynamic Graphs
Premium
Hands holding a tablet with glowing bar and line charts, global map, and financial data visuals on a dark background. Concept of stock market analytics
Dynamic Financial Data Processing with Ascending Lines
Digital Data Processing with Grid Interface
Dynamic Financial Growth Chart on Digital Screen
Stock Market Trends with Digital Graph Overlays: Economic Growth Insights
Premium
Panorama shot analyst team utilizing BI Fintech to analyze financial report with laptop. Businesspeople analyzing BI power dashboard displayed on laptop screen for business insight. Scrutinize
Digital Data Processing Interface on Screen Grid
Dynamic Digital Data and Technology Interfaces
Economic Downturn During Health Crisis Visualization
Digital Interface with Graphs and Notification Alerts
Premium
Profile of woman and financial technology concept. Artificial intelligence. Wide angle visual for banners or advertisements.
Fluctuating Financial Trends and Market Analysis
Abstract Financial Chart with Declining Red Lines
Red Financial Data Graphic on Grid with Arrow Trendline
Global Finance Indicators Falling with Red Line on Grid
Premium
Man look at the dashboard with graphs and charts. Concept of data management system, business intelligence, data statistics, marketing analysis, key performance indicators (KPI) and analytics.
Abstract Digital Art of Purple Shapes on Textured Blue Background
Abstract Digital World Map with Business Diagrams
Financial Data Visualization with Grid and Graph Lines
Abstract Financial Data Processing Blue Grid Background
Premium
Business meeting with hands on documents, charts, and graphs. Focus on data analysis, strategy, and teamwork. Professional setting data analysis meeting with digital overlay.
Red up and down financial graph on grey digital background
Biometric Fingerprint with Declining Graph on Digital Grid
Rising Green Graph on Financial Data Grid Background
Abstract Financial Data Virtual Interface on Grid Background
Premium
Data analytics and insights powered by big data and artificial intelligence technologies. Data scientist working with complex information analysed by AI for business analytics dashboard with charts.
Declining Financial Market Trends with Red Graph Lines
Visual Dynamic Data Analytics Interface with Finance Graph
Stylized Dashboard Displaying Colored Data Analytics Line Graphs
Rising Financial Statistics on Digital Grid Background
Dynamic Graph Lines Over Digital Grid Background
Bitcoin Symbol with Dynamic Market Trends and Data Graphics
Premium
Professional Financial Data Analysts Working in a Modern Monitoring Office with Live Analytics Feed on a Big Digital Screen. Monitoring Room with Finance Specialists Sit in Front of Computers.
Bitcoin Value Decline with Red Graph on Grayscale Grid
Circuitry and Data Stream on Digital Grid Background
Global Financial Stock Market Analysis and Data Visuals
Green Line Graph Over Digital Grid Highlighting Data Trends
Premium
Dashboard finance management on laptop computer analyzing sales data and growth graph chart report. Business planning, strategy and development. Financial accounting. market research, data analysis
Dramatic Red Line Graph on Dark Grid Background
Rising Financial Trends with Virus Background in Digital Interface
Dynamic Stock Market Trends and Data Visualization
Financial Data Visualization Overlaying Metropolitan Cityscape
Premium
Data science and big data technology. Scientist computing, analysing and visualizing complex data set on computer. Data mining, artificial intelligence, machine learning, business analytics.
Blue Financial Graphs Illustrating Market Growth and Economic Optimism
Dynamic Charts and Lines Displaying Financial Data Trends
Financial Data Processing and Analysis with Digital Interface
Abstract Blue Graphical Financial Analysis on Grid Background
Premium
Data science and big data technology. Engineer computing, analysing and visualizing complex data stream on computer. Data mining, artificial intelligence, machine learning, business analytics.
Digital Data Visualization Chart with Trend Lines
Dynamic Financial Data Chart with Red Trend Line on Green Background
Digital Financial Data Processing on Grey Grid Background
Data Visualization Digital Chart Display on White Background
Premium
Big data technology and data science. Data scientist querying, analysing and visualizing complex information on virtual screen. Data flow concept. Business analytics, finance, neural network, AI, ML.
Red Line Graph Showing Financial Decline on Grid Background
Digital Data Analysis Concept with Graph on Grid Background
Falling Stock Market with Red Downward Graph and Numbers
Digital Data Analysis with Network Connections on a Grid Background
Premium
Businessman analyzing financial, fund, account data from growing investments. Virtual graph reporting using digital technology. Man touching tablet at working room. Business finance growth concept.
Vivid Line Graphs Over Cityscape Grid on Data Dashboard
Dynamic Financial Dashboard Depicting Business Analytics
Digital Finance Interface with Dynamic Trading Data Displays
Dynamic Financial Graph with Statistical Analysis Lines
Abstract Digital Interface with Data Analytics Chart Elements
Declining Financial Trends with Red Graph Lines on Grid
Premium
Businessman using laptop computer analyzing sales data and financial growth graph chart report. Business planning, strategy and development. Financial accounting. market research, data analysis
Blue Graphs Over Stock Market Data on Digital Screen
Digital Interface with Advanced Data Processing Visualization
Dynamic Interface with Data Streams and Circuit Design
Graph Data Visualization on Blue 3D Grid Design
Premium
Man look at the dashboard with graphs and charts. Concept of data management system, business intelligence, data statistics, marketing analysis, key performance indicators (KPI) and analytics.
Colorful Graphs Indicating Financial Data Analysis Over Grid Background
Green Line Graph on Grid Interface Displaying Financial Data Trends
Declining Financial Graph Showing Market Loss
Falling Statistics with Red Graph on Digital Interface
Premium
Big data technology and data science with person touching data flowing on virtual screen. Business analytics, artificial intelligence, machine learning. Engineer or scientist analyzing stream of data.
Declining Stock Market Trends with Digital World Map
Abstract Financial Graph with Upward Trend Line
Stock Market Graph with Fluctuations and Financial Data
Financial Growth Concept with Green Upward Line Graph
Premium
Businessman analyze and visualize complex information on a virtual screen using AI to process data. Big data technology and data science.Data flow.Digital neural network.artificial intelligence
Dynamic Financial Data Graph Visualization on Black Background
Digital Financial Graphs Overlapping Modern Office Scene
Financial Downtrend and Data Analysis Concept
Blue Graph Lines on Data Grid Background Indicate Financial Trends
Premium
Sticky note for creative and analytic brainstorm for business idea with BI data dashboard on laptop screen. Analysis financial data visualization tech for marketing strategy. Prodigy
Data Visualization Social Media Interaction Concept
Dynamic Financial Data Analysis on Graph
6G Cloud Technology Concept with Data Networks and Growth Graphs
Financial Data with Downward Trending Red Line Graph on Grid
Premium
Data analysis science and big data with AI technology. An analyst or Scientist uses a computer and dashboard to analyze information on complex data sets on a computer. Insights development engineer.
Displaying Blue Trend Lines on Grid Analytics Dashboard with Markers and Data Values