
- Home >
- Stock Photos >
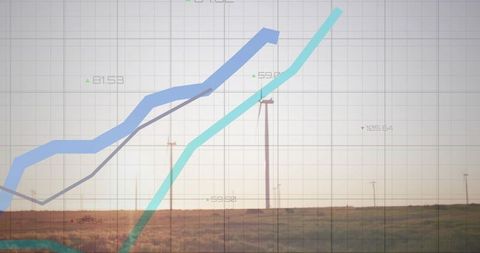
- Abstract Financial Data Visualization Overlay Networking
Abstract Financial Data Visualization Overlay Networking Image

Financial data flows through transparent graphs, integrated with passing business figures, representing the fusion of personal involvement and corporate innovation. Suitable for marketing materials addressing global connectivity in finance, company presentations portraying technological savvy, or informative articles visualizing complex business processes.
Powered by 


downloads
Tags:
More
Credit Photo
If you would like to credit the Photo, here are some ways you can do so
Text Link
photo Link
<span class="text-link">
<span>
<a target="_blank" href=https://pikwizard.com/photo/abstract-financial-data-visualization-overlay-networking/8e971a703951987183f6473f1905a647/>PikWizard</a>
</span>
</span>
<span class="image-link">
<span
style="margin: 0 0 20px 0; display: inline-block; vertical-align: middle; width: 100%;"
>
<a
target="_blank"
href="https://pikwizard.com/photo/abstract-financial-data-visualization-overlay-networking/8e971a703951987183f6473f1905a647/"
style="text-decoration: none; font-size: 10px; margin: 0;"
>
<img src="https://pikwizard.com/pw/medium/8e971a703951987183f6473f1905a647.jpg" style="margin: 0; width: 100%;" alt="" />
<p style="font-size: 12px; margin: 0;">PikWizard</p>
</a>
</span>
</span>
Free (free of charge)
Free for personal and commercial use.
Author: Creative Art
Similar Free Stock Images

Premium


Premium


Premium

Premium


Premium


Premium

Premium

Premium

Premium


Premium


Premium


Premium


Premium


Premium


Premium


Premium


Premium

Premium


Premium


Premium


Premium


Premium


Premium

Premium


Premium


Explore More Free Stock Images