- Home >
- Stock Photos >
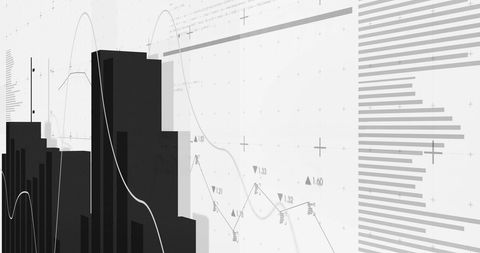
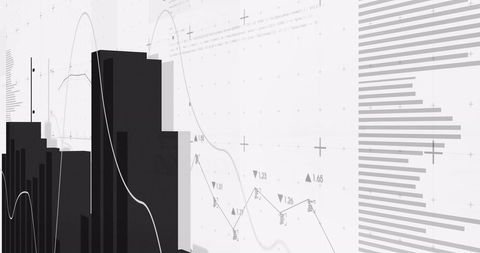
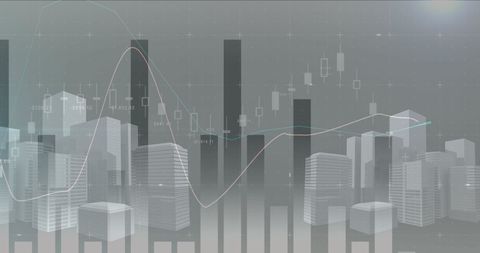
- Abstract Financial Data Visualization with Black Bars and Lines
Abstract Financial Data Visualization with Black Bars and Lines Image
This modern depiction of financial data processing includes abstract black bars with a curved line illustrating data trends, perfect for business presentations and reports. It can be used in contexts emphasizing economic analysis, forecasting, or reporting. The minimalist design highlights the importance of data-driven decision making in global business environments.

downloads
Tags:
More
Credit Photo
If you would like to credit the Photo, here are some ways you can do so
Text Link
photo Link
<span class="text-link">
<span>
<a target="_blank" href=https://pikwizard.com/photo/abstract-financial-data-visualization-with-black-bars-and-lines/b26b77c06131a8d76d0b5de9b226e8c8/>PikWizard</a>
</span>
</span>
<span class="image-link">
<span
style="margin: 0 0 20px 0; display: inline-block; vertical-align: middle; width: 100%;"
>
<a
target="_blank"
href="https://pikwizard.com/photo/abstract-financial-data-visualization-with-black-bars-and-lines/b26b77c06131a8d76d0b5de9b226e8c8/"
style="text-decoration: none; font-size: 10px; margin: 0;"
>
<img src="https://pikwizard.com/pw/medium/b26b77c06131a8d76d0b5de9b226e8c8.jpg" style="margin: 0; width: 100%;" alt="" />
<p style="font-size: 12px; margin: 0;">PikWizard</p>
</a>
</span>
</span>
Free (free of charge)
Free for personal and commercial use.
Author: Creative Art