
- Home >
- Stock Photos >
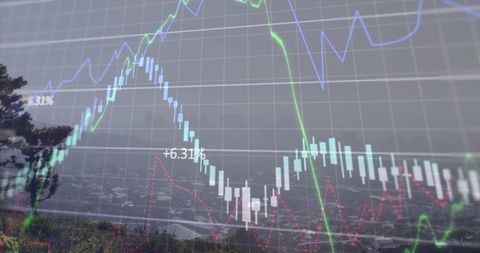
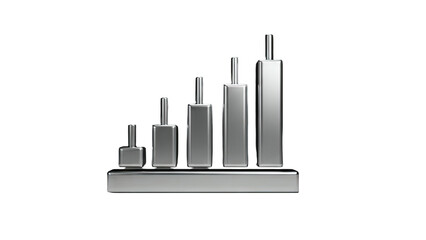
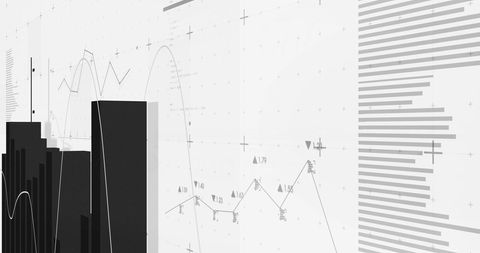
- Abstract Financial Data Visualization with Graphs and Chart Analysis
Abstract Financial Data Visualization with Graphs and Chart Analysis Image

Features complex financial data representations with 3D bars and line graphs, suitable for illustrating financial forecasts, technology advancements, or showcasing data analysis tools in presentations, reports, and educational materials. Ideal for emphasizing technological impact on financial modeling.
Powered by 


downloads
Tags:
More
Credit Photo
If you would like to credit the Photo, here are some ways you can do so
Text Link
photo Link
<span class="text-link">
<span>
<a target="_blank" href=https://pikwizard.com/photo/abstract-financial-data-visualization-with-graphs-and-chart-analysis/68c4f87a2efb4045be40a33b54fd9038/>PikWizard</a>
</span>
</span>
<span class="image-link">
<span
style="margin: 0 0 20px 0; display: inline-block; vertical-align: middle; width: 100%;"
>
<a
target="_blank"
href="https://pikwizard.com/photo/abstract-financial-data-visualization-with-graphs-and-chart-analysis/68c4f87a2efb4045be40a33b54fd9038/"
style="text-decoration: none; font-size: 10px; margin: 0;"
>
<img src="https://pikwizard.com/pw/medium/68c4f87a2efb4045be40a33b54fd9038.jpg" style="margin: 0; width: 100%;" alt="" />
<p style="font-size: 12px; margin: 0;">PikWizard</p>
</a>
</span>
</span>
Free (free of charge)
Free for personal and commercial use.
Author: Awesome Content
Similar Free Stock Images

Premium


Premium


Premium


Premium


Premium


Premium


Premium


Premium


Premium
Premium


Premium


Premium


Premium


Premium


Premium


Premium


Premium


Premium

Premium


Premium


Premium


Premium


Premium


Premium


Premium

Explore More Free Stock Images