1. Home > 
  2. Stock Photos > 
  3. Abstract Financial Data Visualization with Graphs and Charts

Abstract Financial Data Visualization with Graphs and Charts Image

Abstract Financial Data Visualization with Graphs and Charts

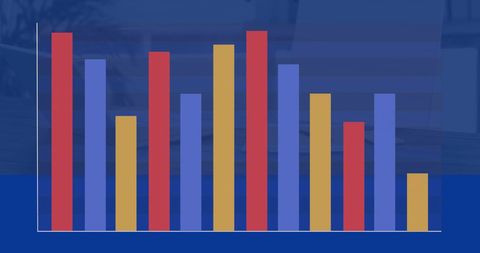
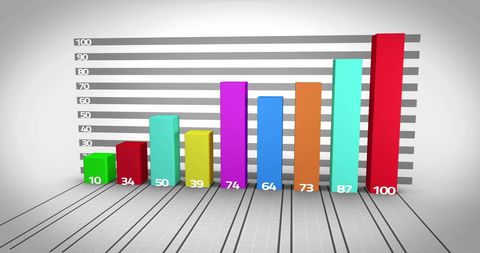
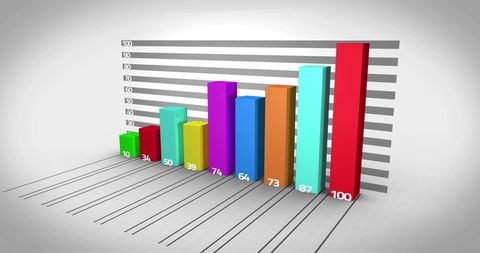
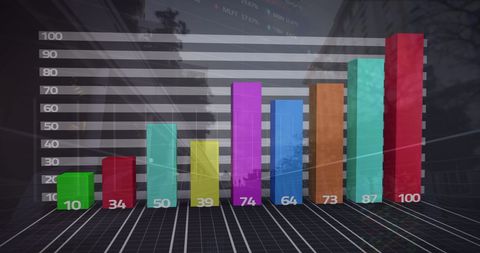
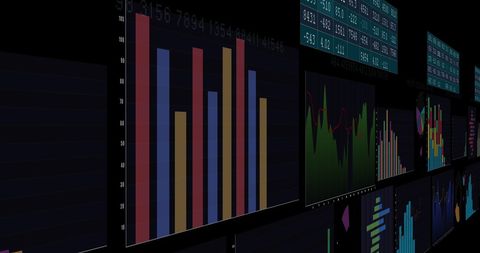
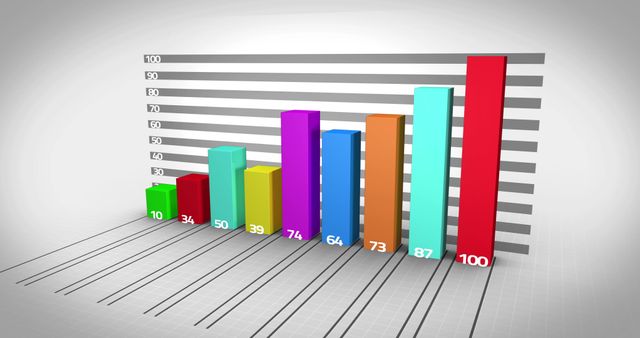
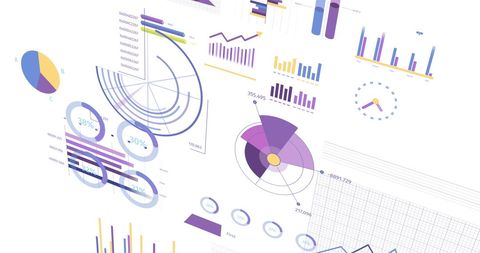
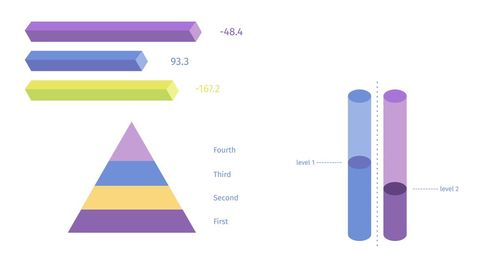
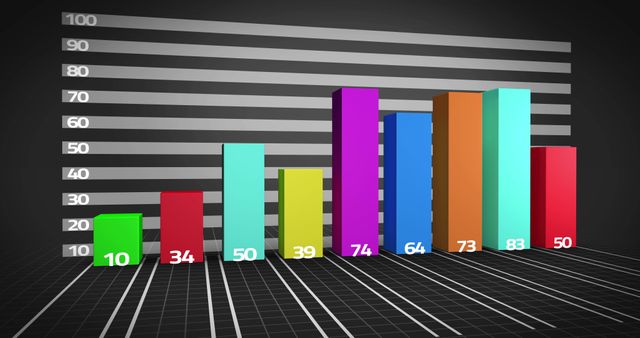
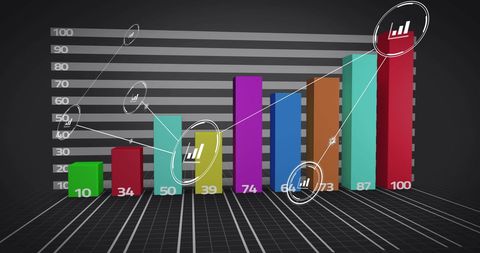
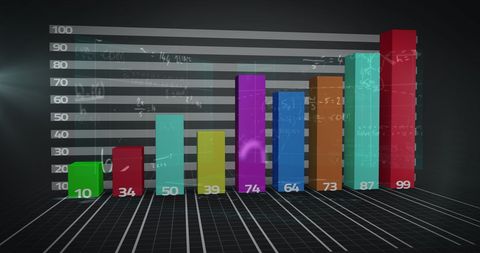
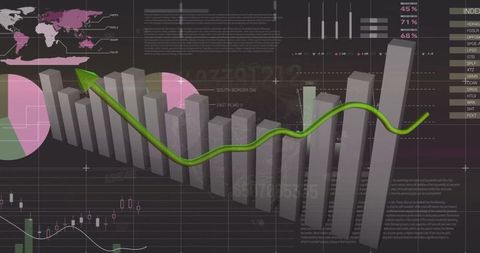
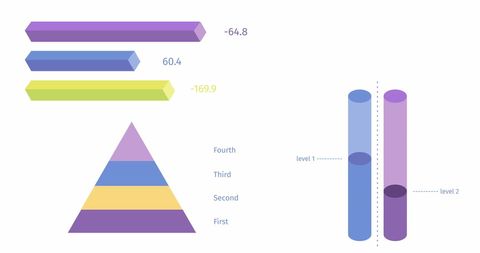
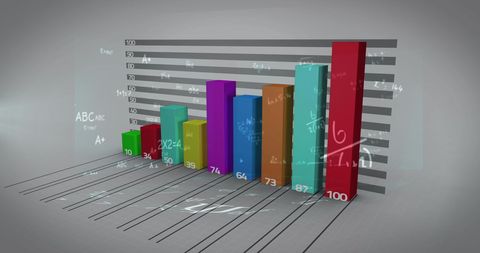
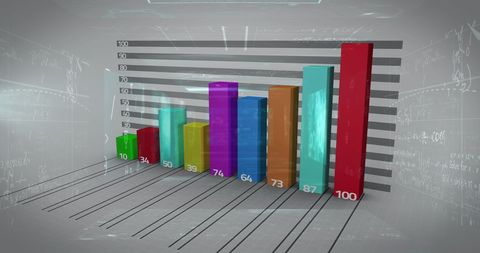
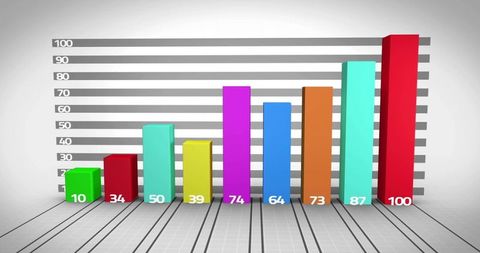
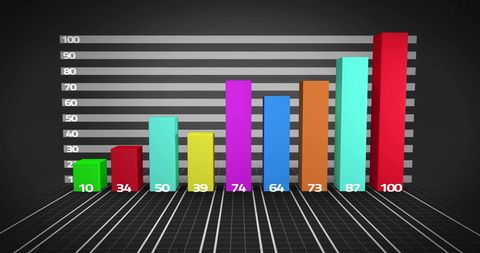
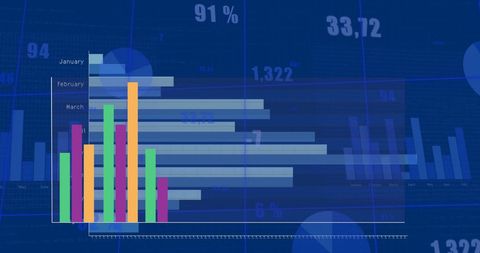
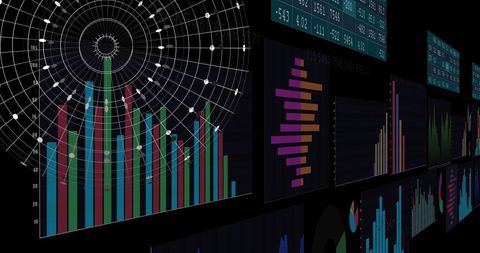
This abstract illustration depicts various financial and statistical charts and graphs, including bar graphs, line graphs, and pie charts, presented on a white background. The scene represents data analytics and the digital processing of financial information. Ideal for use in articles and presentations on finance, data management, business analyses, and digital processes.

Powered by Adobe logo
Ai generated image of blue financial graph with upward trend isolated on transparent background - Powered by AdobeAnalyzing real-time financial market trends and stock performance with vibrant candlestick charts and data displayed on a digital screen, symbolizing investment analysis and global economic activity - Powered by AdobeBusiness financial chart with moving up arrow graph.Financial data charts with glowing stock market graphs.Stock market investment data and analysis finance graph.  - Powered by Adobe
Dynamic blue and green digital stock market graph with bar charts and lines on a dark background, representing financial data analysis, investment trends, business growth, and global economy fluctuat - Powered by AdobeA professional analyzing financial data using a digital tablet with dynamic charts and graphs. - Powered by Adobe

Credit Photo

If you would like to credit the Photo, here are some ways you can do so

Free (free of charge)

Free for personal and commercial use.

Author: People Creations

Similar Free Stock Images

Colorful Data Visualization Bar Graph Analytics Concept
Premium
A business professional engages with financial data on a laptop, surrounded by innovative graphs and charts that signify growth and success in a corporate environment. Scalp
Smartphone and Credit Card Digital Contactless Payment
Multi-Screen Statistical Data Processing Display
Financial and Statistical Data Visualization Concept
Financial Data and Analytics Visualization in Digital Interface
Premium
Data Examination: A magnifying glass hovers over financial reports and charts on a sky-blue surface, providing an overview of the business analysis.
3D Graphical Representations of Financial and Statistical Data Trends
Digital Data Analytics and Financial Graph Analysis
Digital Financial Charts Over Diverse Coworkers in Modern Office
Colorful 3D Bar Chart Visualizing Financial Data with Neon Candlestick Grid Overlay
Colorful 3D Bar Graph on Gradient Background
Abstract Digital Interface: Global Data Visualization
Digital Financial Data Chart Visualization in Blue Tones
3D Bar Graph Over Digital Data Illustrating Business Success
Digital Financial Data Interface Against City Background
Premium
Strategic financial discussion between business partners, analyzing investment data and planning future growth in a corporate environment
Digital Bar Chart Data Visualization on Blue Background
Financial Data Processing with Code Overlays and Graphs
Rising Bar Graph on Dynamic Orange Background
Financial Data Visualization with Colored Charts on Dark Background
Premium
Female expert in glasses looking at screen with financial data
Premium
Trader analyzing financial data on laptop at home office workspace
Digital Financial Data Analytics with Global Charts and Currencies
Premium
Transparent or png stock market investment trading graph growth.Trade business analytics graph and financial chart.
Abstract Financial Data Graph on Purple Background
Digital Bar Graph with Declining Data Points on Green Background
Financial Data Charts over Dark Textured Background
Premium
A business professional engages with a tablet, analyzing financial data presented through interactive charts and graphs, enhancing strategic insights for decision making. Scalp
Premium
Analyzing financial growth charts for strategic business decisions and investment opportunities, envisioning success with data-driven insights and projections
3D Bar and Line Graphs Showing Financial Data Analytics
Colorful 3D Bar Chart Displaying Data Progress Insights
Dynamic Infographic with Charts and Global Network Interface
Premium
Magnifying glass focusing on candlestick chart, showcasing market analysis on a dark background, concept for financial review, investment strategy and business intelligence data analysis
Abstract 3D Bar Chart Overlaid with Financial Graphs
Financial Data Analysis with Currency Insights
Colorful Infographic with Data Bars and pyramid
Futuristic Data Processing with Graphs and Charts Overlay
Colorful Data Visualization and Analysis Concept
3D Financial Charts and Graphs on White Background
Visualizing Financial Data with Dynamic Graphs and Charts
Abstract Data Visualization with Measurement Transparency
Premium
AI finance business data analysis digital technology investment trading market stock, financial analyst using advanced holographic interface for global market insight, smart investment strategy
Premium
The office desk with charts graphs and a laptop  long title A close up view of an organized office desk featuring a laptop financial charts and data
Financial Data with Graphs over Abstract Steps
Global Data Processing Interface with Graphs and Charts
Child Drawing with Financial Data Overlay Visual Concept
Abstract Financial Chart with Dynamic 3D Data Visualizations
Premium
Man analyzing financial data on multiple screens
Abstract Digital Graphs Depicting Financial Statistics Analysis
Abstract Data Visualization with Bars and Pyramids
Composite Business Charts with Cafes Interior
Advanced Digital Interface with Data Analytics Overlaid on Network
Digital Financial Data Integration Concept on White Background
Magenta-to-Violet 3D Bar Chart Rising over Dark Green Grid with Curved Dotted Arrow
Digital Screens Displaying Business Graphs and Data Analytics
Digitally Generated Visionaries Creating Cutting-edge Technology
Premium
Business team is analyzing financial documents, pointing at charts and graphs, discussing strategies and collaborating on a project during a corporate meeting.
3D Graph with Currency Exchange Rates on Black Background
Financial Data Analysis with Trend Graphs and Bar Charts
Data Processing Graph with Digital Interface Elements
Dynamic Data Analytics with Server Visualization
Premium
Business people collaborating in an office, analyzing financial charts and graphs with pens in hand. Utilizing calculators, tablets, and notebooks to strategize and plan for growth
Colorful Bar Graph Over Contrasted Mathematical Equations
Futuristic Data Visualization on Blue Grid Background
Colorful 3D Bar Graph Depicting Financial Data
Premium
Business meeting with financial charts and graphs on screen, pen on document with colorful data analysis in foreground, blurred office background.
Premium
Magnifying glass over financial charts and graphs showing data analysis and growth
Financial Data Visualization with Interactive Graphs and Charts
Digital Data Analysis Concept with Glowing Graph on Purple Background
Digital Data Visualization Charts and Graphs on Purple Background
Colorful Abstract Graphs and Charts for Data Analysis and Presentation
Premium
low-angle view of a corporate skyscraper is overlaid with blue and white stock market graphs and trading charts, representing financial technology and economic data.
Abstract Data Analytics with Digital Statistics and Graphs
Abstract Financial Data Visualizations on Purple Background
Colorful Bar Graph on Dark Background Illustrating Growth
Abstract Financial Chart with Global Market Analytics
Premium
Large screen display showing various business graphs and charts.
3D Bar Graph on Gray Background Displaying Colorful Data
Dynamic Financial Graphs on White Background Indicating Growth
Dynamic Grouped Bar Chart with Red Line on Dark Grid
Digitally Generated Financial Growth Chart on Abstract Background
Abstract Financial Data Visualization with Bar Graphs and Maps
Abstract Data Chart Analysis with Pink Graph on Blue
Futuristic Digital Graph Representing Growth and Analytics
Digital Financial Data Over Team of Office Professionals
Colorful Bar Graph Visualizing Data Trends on Grid Background
Digital Charts Displaying Data Analytics in Technology Background
3D Illustrated Bar Graph with Data Analysis Icons and Connections
Abstract 3D Graph in Digital Retro Aesthetic
Premium
Futuristic glowing blue digital dashboard with interactive charts graphs and analytics showing upward growth trend for business financial and technology data visualization concepts
Colorful Bar Chart with Rising Columns Visualization
Dynamic Visualizations of Data Analytics and AI Algorithms
Colorful Bar Graph with Annotated Progress Data
Digital Financial Analytics and Data Visualization
Colorful Data Visualizations on Dark Background Abstract Design
Data Analysis Overlay with Ukrainian Nuclear Theme
Vibrant Bar Graph and Digital Data Analysis Interface
Colorful Graph with Data Processing Interface Overlay
Abstract Financial Data Chart with Blue Background
Financial Data Analysis with Dynamic Graphs and Charts
Premium
Analyzing financial charts and data reports in modern office setting
Premium
A professional business environment with charts and graphs on a laptop, symbolizing financial analysis, corporate strategy, economic planning, data review, management reporting, growth, consulting, ac
3D Bar Graph with Scientific Background and DNA Visualization
Digital Financial Analytics with Growing Bar Chart
Futuristic Stock Market Growth Bar Graph Cityscape Background
Financial Data Visualization with Bar Charts and Graphs
Premium
Financial market data analysis with glowing 3D bar and line charts on dark background showing economic trends and growth concept visualization. 3D Rendering
Global Financial Data Analysis with Interactive Graphs and Radar
3D Bar Graph with Green Arrow Showing Economic Growth
Interface with Statistical Data Visuals Against Servers
Colorful 3D Bar Graph Over Urban Scene for Business Analysis
Premium
Female professional analyzing business data and financial charts on a laptop screen while working in a modern office environment.
Premium
Ai generated image of laptop displaying financial data analysis charts and graphs isolated on transparent background
Colorful Bar Charts on Black Background Displaying Financial Data
Colorful 3D Bar Graph with Floating Mathematical Equations
Digital Representation of Financial Analytics with Graphs and Charts
Premium
Close-up of business people hands pointing at data charts and using a tablet during a strategy meeting in a bright, modern office space.
Digital Financial Data Infographic on Blue Background
Data Visualization Overlapping Cardboard Boxes in Shipping
Digital Banking Concept with Credit Card and Growth Chart
Financial Growth Analysis Overlaid on German Flag Concept
Colorful Graph on Digital Blue Background
Dynamic Financial Data Representation on Purple Gradient
Colorful Data Charts and Graphics on White Background
Explore More Free Stock Images