1. Home > 
  2. Stock Photos > 
  3. Abstract Financial Data Visualization with Light Bokeh

Abstract Financial Data Visualization with Light Bokeh Image

Abstract Financial Data Visualization with Light Bokeh

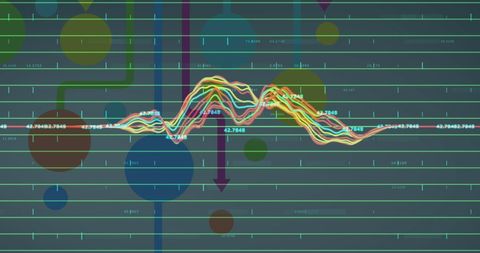
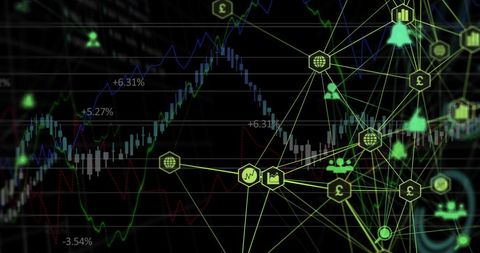
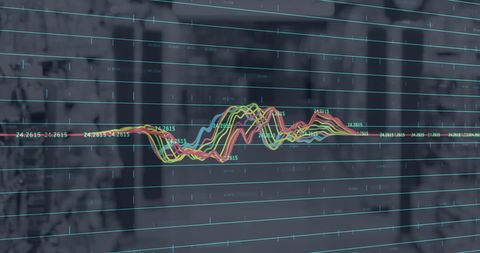
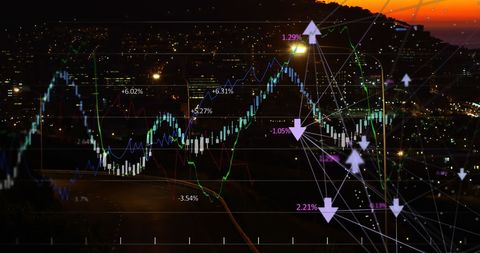
This abstract image combines financial data graphs with light bokeh effects, ideal for illustrating concepts related to digital analytics and global business. Perfect for presentations, websites, and marketing materials focusing on data technology and financial services innovation.

Powered by Shutterstock logo - Get 15% off with code: PIKWIZARD15
Displaying dashboard presenting metrics in office space with bar charts, line graphs and data grid. Technology, data, analytics, business, innovation, visualization, modern - Powered by Shutterstock - Get 15% off with code: PIKWIZARD15Displaying monitor with financial dashboard at desk with magenta and cyan graphs, minecode.py table. Analytics, data visualization, dashboard, technology, digital, insights, software - Powered by Shutterstock - Get 15% off with code: PIKWIZARD15Displaying digital chart on trading desk, with candlestick bars, trend lines and numeric data. Finance, technology, analytics, data visualization, investment, stock market, dashboard - Powered by Shutterstock - Get 15% off with code: PIKWIZARD15Analyzing Financial Data Trends with Interactive Digital Visualization Tools. - Powered by Shutterstock - Get 15% off with code: PIKWIZARD15Displaying financial graphics over urban night intersection with numeric overlays, candlestick bars. Urban, technology, data visualization, futuristic, innovation, analytics, digital - Powered by Shutterstock - Get 15% off with code: PIKWIZARD15

Credit Photo

If you would like to credit the Photo, here are some ways you can do so

Free (free of charge)

Free for personal and commercial use.

Author: Creative Art

Similar Free Stock Images

Futuristic Financial Analysis Concept with Neon and Digital Graphs
Premium
Interactive Financial Data Visualization with Trading Algorithms.
Futuristic Digital Data Analysis with Vibrant Graphs
Global Data Processing with Digital Interface and World Map
Digital Network Over Financial Graph with Data Integration Overlay
Digital Network Connections Visualization with Data Analysis Graphs
Futuristic Data Visualization with Sine Wave and Digital Elements
Complex Financial Data Visuals with Coding Elements and Charts
Premium
Analyzing Financial Data Trends with Interactive Digital Visualization Tools.
Dynamic Cybersecurity Interface with Lock and Data Charts
Colorful Data Analytics with Charts and Graphs on Digital Interface
Premium
Image of graphs and financial data over office buildings. Business, finance, economy and technology concept digitally generated image.
Futuristic Neon Data Wave Visualization in Cyber Grid Display
Digital Data Processing with Dynamic Scope Overlay
Digital Network with Declining Graph Overlay
Futuristic Digital Financial Network and Economic Growth
Premium
Concept of technology for company financial analysis On the screen, modern visual interface displays large amounts of data from business sales reports, profit charts, and stock market trend research.
Soundwaves with Graph Overlays in Data Processing Concept
Global Data Connections with Financial Insights
Digital Data Visualization with Global Connection Elements
Futuristic Financial Data Analysis with Dynamic Charts and Graphs
Premium
Stock trader analyzing data on digital display in office, with bar and line charts, copy space. Technology, finance, analytics, data visualization, innovation, investment, digital
Business Executive Analyzing Digital Stock Market Data
City Skyline with Abstract Financial Graph Overlay
Abstract Neon Waveforms on Digital Grid Layout
Global Financial Data Overlaying Animated World Map
Premium
Financial Data Analytics and Mobile Technology Concept.
Digital Financial Data Graph with Winter Snowflake Theme
Diverse Data and Graphs on Digital Screen for Global Business Concepts
Abstract Digital Finance Graph Interface Display
Dynamic Stock Market Graph on Digital Interface
Premium
Displaying financial chart on trading dashboard, with white polyline and green candlestick bars. Technology, analytics, finance, digital, data, investment, modern
Digital Security and Data Growth Concept with Holographic Padlock
Abstract Financial Graphs and Light Trails on Digital Grid
Abstract Waveform Data Visualization in Futuristic Digital Network
Futuristic Data Visualization Interface with Globe and Analytics
Digital Interface with Data Sharing and Connection Network
Digital Data Analysis Over Cityscape with Scope Overlay
Premium
Displaying colorful bar chart on finance screen over city with scrolling tickers and numeric axes. Analytics, data visualization, modern, technology, finance, urban, digital
Premium
Displaying financial dashboard on screen showing bar charts, line graphs, gauges, percentage arrows. Technology, analytics, data visualization, dashboard, finance, digital, futuristic
Global Financial Data and Statistics Over World Map
Futuristic Digital Core with Energy Streaks in Space
Digital Globe with Stock Market Data and Network Icons
3D Financial Data Stream with Floating Digital Icons
Red Financial Graph Indicates Declining Market Trends
High-Tech Digital Pound Currency with Data Analysis
Abstract Data Visualization with Digital Interface Overlays
Abstract Data Analysis Overlay on Coastal Landscape
Abstract Global Stock Market Chart with Graphs
Premium
Stock Market Data Visualization and Financial Trading Analytics Dashboard on Touchscreen Tablet.
Financial Data Analysis with Digital Network Connectivity
Dynamic Financial Graphs on Digital Screen Displaying Market Trends
Digital Interface with Scanning Lines and Data Symbols
Futuristic Stock Market Analytics with Global Human Interface
Premium
Image of graphs, numbers, lens flares and map over low angle view of building. Digital composite, multiple exposure, illuminated, report, finance, business, growth, global and technology.
Complex Digital Financial Data on Grid
Red Neural Network on Digital Interface Background
Financial Data Visualization with Network of Connections
Digital Data Processing on Interconnected Network
Premium
Displaying transparent data table overlaying screen, tracing line graphs and turquoise dot clusters. Analytics, data visualization, cybersecurity, technology, digital interface, performance,
Digital Financial Data Overlay on Retail Environment
Dynamic Data Visualization with Urban Background
Financial Market Trends Over City Lights Digital Interface Concept
Abstract Network Connections with Financial Data Overlay
Futuristic Digital Data Visualization with Circuit Overlays
Premium
Displaying trading dashboard on screen with line graphs, bar charts, numeric data and lens flare. Technology, analytics, innovation, finance, data visualization, futuristic, digital
Premium
Interactive Financial Data Visualization with Trading Algorithms.
Premium
Business Intelligence Dashboard visual display of Marketing Data Analytics provides of key metrics and KPI economic analysis and investment finance and marketing planning, Big data Graphs Charts.
Abstract Digital Data Processing Background with Graphs
Digital Data Analysis on Futuristic Interface Background
Financial Data Security Concept with Graphs and Padlock
Futuristic Digital Interface with Global Finance Graphs
Premium
Reviewing data professional man using smartphone at wooden desk with financial charts, copy space. Financial analysis, business intelligence, data visualization, workspace, professional, modern,
Digital Data Process and Analysis on Blue Background
Dynamic Data Processing with Colorful Visual Analytics Interface
Digital Network Connections and Financial Data Analysis
Digital Finance Graph with Data Points on Dark Background
Premium
Projecting floating financial data, grid lines and trend line overlay over blurred city building. Data visualization, financial analytics, modern architecture, urban landscape, technology, corporate
Cyber Security Shield over Dynamic Global Data Network
Futuristic Digital Finance Interface with Technology Elements
Financial Market Data Visualization with Global Chart Overlay
Digital Data Streams and Circuit Board Imagery Concept
Premium
Showing financial data dashboard visualization at virtual interface, with candlesticks and 54.05. Financial, analytics, visualization, digital, gauge, interface, technology
Digital Network Connections with Social Media Icons and Grid
Digital Data Visualization with Futuristic Infographics
Futuristic Circuit Board with Holographic Dots
Red Financial Trendline in Digital Interface Background
Premium
Overlaying financial data onto city skyline with colored graphs, candlesticks, numbers and gauges. Technology, analytics, data visualization, finance, urban environment, futurism, innovation
Global Financial Data Processing with Digital Network
Digital Network with Symbols and Data Visualization
Abstract Digital Graph with Fluctuating Connectivity Lines
Colorful Digital Waveform with Analytical Overlay and Red Grid Lines
Premium
Data Visualization. Analyst interpreting financial graphs and data.
Complex Mathematical Formulae Overlay on Digital Grid
Data Analysis and Graphs Displaying Stock Market Trends
Digital Data Mapping and Global Connectivity Insights
Light Bulb and Cloud Icons With Data Processing Interface
Global Financial Data Technology Display Across World Map
Digital Network and Cybersecurity with Spyware Elements
Financial Data Visualization with Global Connectivity
Financial Data and Network Connections Over Black Background
Abstract Financial Data Visualization with Multicolored Graphs
Financial Data Patterns over Cityscape at Dusk with Business Indicators
Dynamic Data and Graphs on Digital Screen
Financial Data Analysis Graph with Growing Trends
Glowing Digital World Map with Financial Data Synthesis
Premium
Interactive Financial Data Visualization with Trading Algorithms.
Premium
Displaying trading platform interface showing candlestick bars and line graph, with grid and labels. Finance, investment, analytics, data visualization, technology, digital, business
Cybersecurity in Financial Data Network Analysis
Dynamic Data Processing with Digital Interfaces in Motion
Futuristic Data Analytics Interface with Multi-layered Graph
Dynamic Digital Data Display with Vibrant Graphs
Premium
Digital financial graphs and charts displayed on a laptop screen, representing online trading and market analysis on a dark background. Concept of investing, stock market, and financial growth
Abstract Financial Graphs Overlapping Data Center
Abstract Financial Data Processing with Digital Graphs
Digital Data Processing and Global Connectivity Illustrated
Abstract Data Flow and Digital Global Business Interface
Premium
Image of financial data processing over cityscape. Global finance, business, connections, computing and data processing concept digitally generated image.
Dynamic Red Line Graph on Digital Black Grid Background
Futuristic Data Processing Background with Floating Bokeh
Global Financial Data Analytics Over Digital World Map
Futuristic Data Networking with Digital Lines and Numbers
Premium
Displaying 3D bar chart rising on wireframe grid in virtual dashboard, with green red data columns. Financial, analytics, futuristic, data visualization, digital, technology, business
Abstract Network Visualization with Woman's Profile and Digital Data
Statistics and Data Processing with Graphs and Charts
Explore More Free Stock Images