- Home >
- Stock Photos >
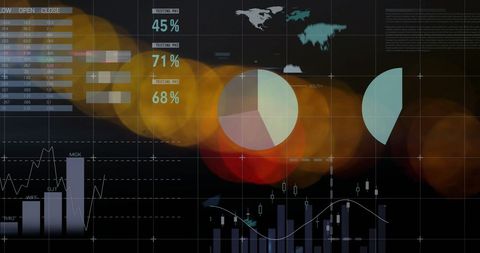
- Abstract Financial Data Visualization with Light Overlays
Abstract Financial Data Visualization with Light Overlays Image

Abstract visual representation of financial data featuring charts and light effects overlaying dark background. Suitable for illustrating concepts related to finance, economics, or data analysis. Use for business presentations, financial reports, or digital marketing materials to convey a professional and modern technology-focused theme.

downloads
Tags:
More
Credit Photo
If you would like to credit the Photo, here are some ways you can do so
Text Link
photo Link
<span class="text-link">
<span>
<a target="_blank" href=https://pikwizard.com/photo/abstract-financial-data-visualization-with-light-overlays/521f797e1547f28af1c4c6a5be222ea4/>PikWizard</a>
</span>
</span>
<span class="image-link">
<span
style="margin: 0 0 20px 0; display: inline-block; vertical-align: middle; width: 100%;"
>
<a
target="_blank"
href="https://pikwizard.com/photo/abstract-financial-data-visualization-with-light-overlays/521f797e1547f28af1c4c6a5be222ea4/"
style="text-decoration: none; font-size: 10px; margin: 0;"
>
<img src="https://pikwizard.com/pw/medium/521f797e1547f28af1c4c6a5be222ea4.jpg" style="margin: 0; width: 100%;" alt="" />
<p style="font-size: 12px; margin: 0;">PikWizard</p>
</a>
</span>
</span>
Free (free of charge)
Free for personal and commercial use.
Author: Awesome Content