
- Home >
- Stock Photos >
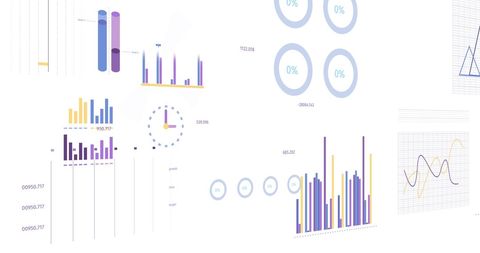
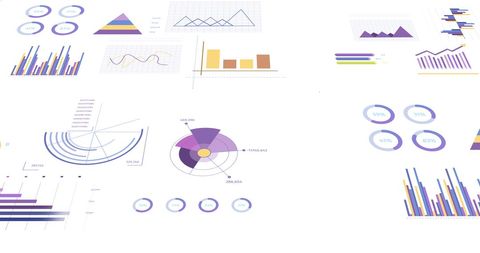
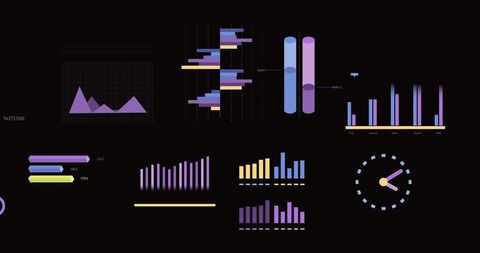
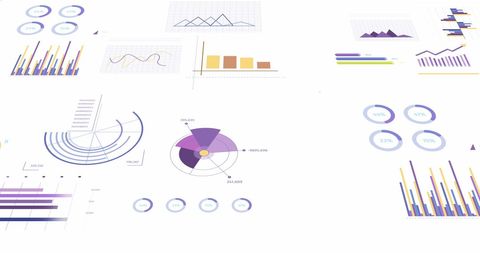
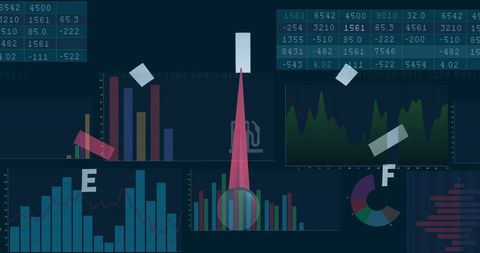
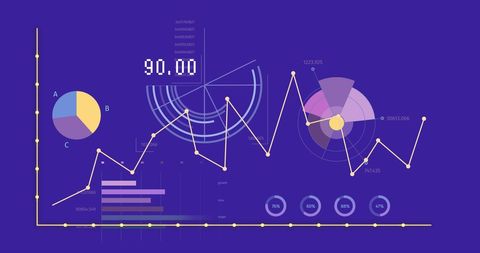
- Abstract Financial Data Visualizations on Purple Background
Abstract Financial Data Visualizations on Purple Background Image

Colorful graphical representation featuring multiple financial charts arranged on a sleek purple background. Includes bar charts, line graphs, and infographic elements showcasing dynamic data analysis and statistics. Ideal for presentations, fintech design, educational materials on financial trends, and business strategy visuals.
Powered by  - Get 15% off with code: PIKWIZARD15


downloads
Tags:
More
Credit Photo
If you would like to credit the Photo, here are some ways you can do so
Text Link
photo Link
<span class="text-link">
<span>
<a target="_blank" href=https://pikwizard.com/photo/abstract-financial-data-visualizations-on-purple-background/631ab589a720ded92edb350f2b680397/>PikWizard</a>
</span>
</span>
<span class="image-link">
<span
style="margin: 0 0 20px 0; display: inline-block; vertical-align: middle; width: 100%;"
>
<a
target="_blank"
href="https://pikwizard.com/photo/abstract-financial-data-visualizations-on-purple-background/631ab589a720ded92edb350f2b680397/"
style="text-decoration: none; font-size: 10px; margin: 0;"
>
<img src="https://pikwizard.com/pw/medium/631ab589a720ded92edb350f2b680397.jpg" style="margin: 0; width: 100%;" alt="" />
<p style="font-size: 12px; margin: 0;">PikWizard</p>
</a>
</span>
</span>
Free (free of charge)
Free for personal and commercial use.
Author: Creative Art
Similar Free Stock Images

Premium


Premium

Premium


Premium


Premium


Premium

Premium

Premium


Premium

Premium

Premium


Premium


Premium

Premium

Premium


Premium


Premium


Premium


Premium


Premium

Premium


Premium

Premium

Premium

Premium

Explore More Free Stock Images