
- Home >
- Stock Photos >
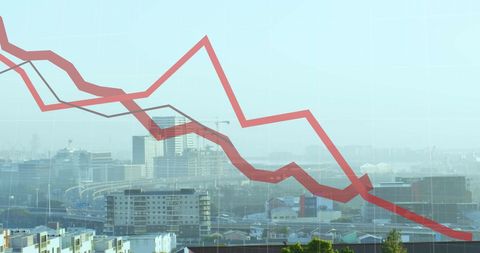
- Abstract Financial Data with Declining Red Chart
Abstract Financial Data with Declining Red Chart Image

Abstract illustration showing financial data with a prominent red line chart indicating decline against a network of geometric shapes and dots. Ideal for presentations on market analysis, financial reports, economic discussions, or emerging technologies in finance. Can be used to symbolize negative investment trends, stock market impacts, or futuristic data representation.
Powered by 


downloads
Tags:
More
Credit Photo
If you would like to credit the Photo, here are some ways you can do so
Text Link
photo Link
<span class="text-link">
<span>
<a target="_blank" href=https://pikwizard.com/photo/abstract-financial-data-with-declining-red-chart/dcf7519249157ab14af643bdebf8ebef/>PikWizard</a>
</span>
</span>
<span class="image-link">
<span
style="margin: 0 0 20px 0; display: inline-block; vertical-align: middle; width: 100%;"
>
<a
target="_blank"
href="https://pikwizard.com/photo/abstract-financial-data-with-declining-red-chart/dcf7519249157ab14af643bdebf8ebef/"
style="text-decoration: none; font-size: 10px; margin: 0;"
>
<img src="https://pikwizard.com/pw/medium/dcf7519249157ab14af643bdebf8ebef.jpg" style="margin: 0; width: 100%;" alt="" />
<p style="font-size: 12px; margin: 0;">PikWizard</p>
</a>
</span>
</span>
Free (free of charge)
Free for personal and commercial use.
Author: Awesome Content
Similar Free Stock Images

Premium


Premium

Premium


Premium


Premium


Premium


Premium


Premium

Premium


Premium


Premium


Premium


Premium


Premium


Premium


Premium

Premium


Premium


Premium

Premium

Premium


Premium


Premium


Premium


Premium


Explore More Free Stock Images