
- Home >
- Stock Photos >
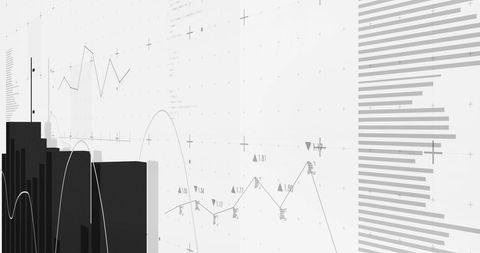
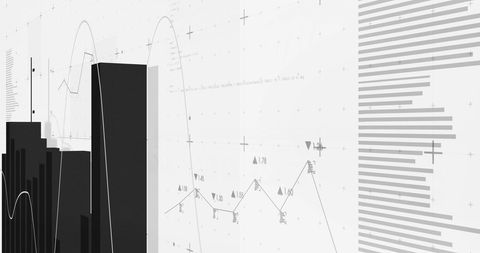
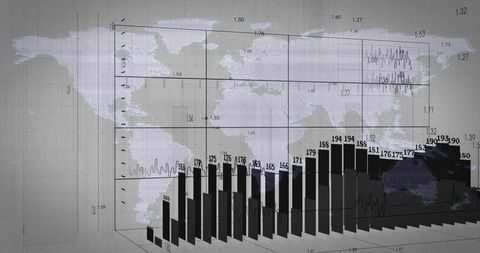
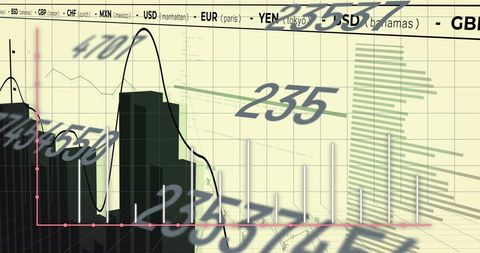
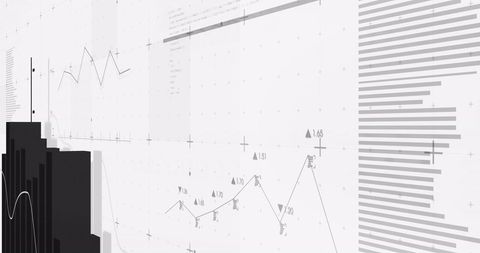
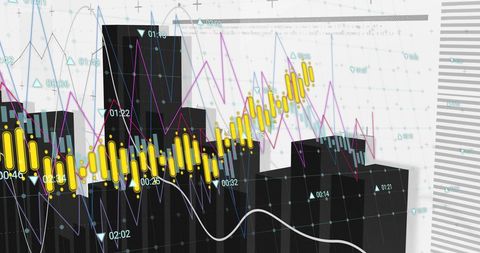
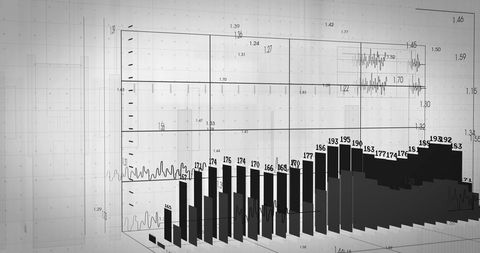
- Abstract Financial Data with Graphical Elements and Analysis
Abstract Financial Data with Graphical Elements and Analysis Image
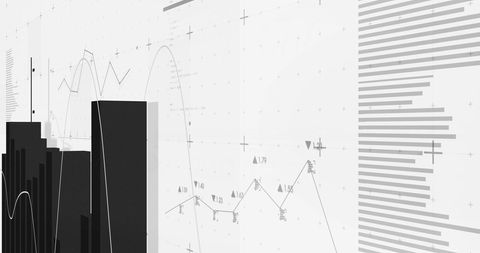
This illustration showcases abstract representations of financial data with various graphical elements like bar charts and line graphs on a predominantly white background. It epitomizes a modern digital interface, conducive for themes related to business financial analysis, data science, or technology-focused projects. Ideal for use in presentations, corporate websites, analytical software advertising, and informational materials focusing on economic data and connections.
Powered by 


downloads
Tags:
More
Credit Photo
If you would like to credit the Photo, here are some ways you can do so
Text Link
photo Link
<span class="text-link">
<span>
<a target="_blank" href=https://pikwizard.com/photo/abstract-financial-data-with-graphical-elements-and-analysis/0fca62f0d88ba798166d0e256510f5de/>PikWizard</a>
</span>
</span>
<span class="image-link">
<span
style="margin: 0 0 20px 0; display: inline-block; vertical-align: middle; width: 100%;"
>
<a
target="_blank"
href="https://pikwizard.com/photo/abstract-financial-data-with-graphical-elements-and-analysis/0fca62f0d88ba798166d0e256510f5de/"
style="text-decoration: none; font-size: 10px; margin: 0;"
>
<img src="https://pikwizard.com/pw/medium/0fca62f0d88ba798166d0e256510f5de.jpg" style="margin: 0; width: 100%;" alt="" />
<p style="font-size: 12px; margin: 0;">PikWizard</p>
</a>
</span>
</span>
Free (free of charge)
Free for personal and commercial use.
Author: Authentic Images
Similar Free Stock Images
Premium


Premium


Premium

Premium

Premium

AI


Premium


Premium

Premium


Premium


Premium


Premium

Premium


Premium


Premium


Premium


Premium


Premium

Premium


AI

Premium


Premium


Premium


Premium


Premium


Premium


Premium


Explore More Free Stock Images