1. Home > 
  2. Stock Photos > 
  3. Abstract Financial Data with Green Arrows and Graphs

Abstract Financial Data with Green Arrows and Graphs Image

Abstract Financial Data with Green Arrows and Graphs

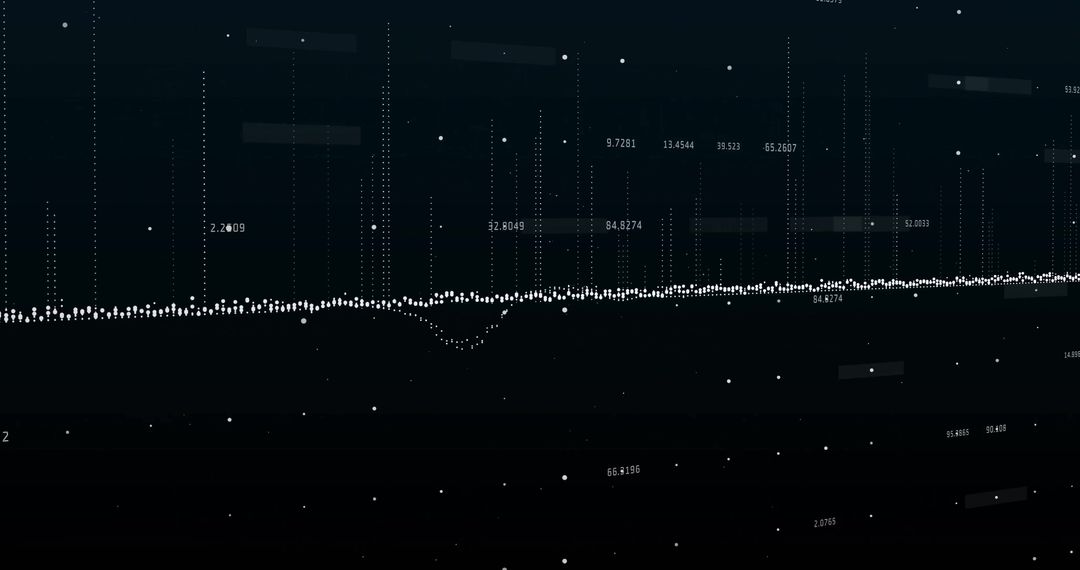
Image intricately illustrating financial data processing trends with upward green arrows superimposed on a sophisticated digital graph interface set against a dark background. Suitable for financial technology advertising, economic analysis reports, or articles focusing on market trends and data analytics.

Powered by Shutterstock logo - Get 15% off with code: PIKWIZARD15
Stock market analysis, business, finance and investment. Finance analyst analyzing stock market trading graph, economic growth chart, planning and strategy, business investment with financial report - Powered by Shutterstock - Get 15% off with code: PIKWIZARD15Business, finance and investment concept. Businessman using digital tablet analyzing and calculating financial data with economic graph growth chart, Business strategy and planning. market research - Powered by Shutterstock - Get 15% off with code: PIKWIZARD15Stock market or forex trading graph in futuristic concept suitable for financial investment or Economic trends business idea and all art work design. Abstract finance background - Powered by Shutterstock - Get 15% off with code: PIKWIZARD15Stock exchange market graph analysis background - Powered by Shutterstock - Get 15% off with code: PIKWIZARD15Online trading, Investment, Strategy market plan, and Stock mark - Powered by Shutterstock - Get 15% off with code: PIKWIZARD15

Credit Photo

If you would like to credit the Photo, here are some ways you can do so

Free (free of charge)

Free for personal and commercial use.

Author: Creative Art

Similar Free Stock Images

Futuristic 3D DNA Strand with Dynamic Particle Network
Premium
Stock graph and financial chart. Analyze stock market finance volume of stock market with Graph and chart holograph technology. High quality photo
Digital Data and Cloud Computing with Green Light Effects
Glowing Dots and Wavy Lines on Black Background Illustrating Digital Expansion
Abstract Digital Network with Dynamic Connections on Dark Background
Dynamic Growth Chart with Rising Arrows in Green Tones
Premium
Financial stock market numbers and city light reflection
Digital Network Over Financial Graph with Data Integration Overlay
Digital Network with Connected Icons and Data Streams
Dynamic Stock Market Graph Displaying Surging Growth
Dynamic Glowing Digital Graphs on 3D Grid Background
Premium
Analyst working with Financial Data and Business Analytics Dashboard on computer to make Financial Report with KPI and Metrics. Investment, Corporate Finance, Strategy, Operations, Sales.
Digital Interface with Graphs and Data Lines in Cyber Space
Dynamic Stock Market Graph with Green Arrows and Numbers
Global Finance and COVID-19 Impact Representation
Digital Globe and Line Graph for Global Business Analysis
Premium
Businessman using laptop computer analyzing sales data and financial growth graph chart report. Business planning, strategy and development. Financial accounting. market research, data analysis
Abstract Network Connections with Financial Data Overlay
Dynamic Data Processing Concept in Digital Interface Design
Graphical Data Analysis on Digital Interface
Digital Graph with Rising and Falling Lines on Grid Background
Premium
Financial advisor explaining invest stock market data consulting investor. Two busy business men analysts doing finance trading analysis pointing at exchange chart on laptop screen working in office.
Cloud Data Visualization and Analytics Design
Fingerprint Biometrics with Data Analytics and Networking Visualization
Data Visualization on Digital Grid with Technological Interface
Digital Finance Concept with Data Visualization and Network Icons
Premium
Young indian business man trader wearing glasses looking at computer screen with trading charts reflecting in eyeglasses watching stock trading market financial data growth concept, close up.
Global Financial Data Processing with Abstract Graphs
Financial Data Visualization on World Map with Graph Analytics
Financial Data with Molecular Background Concept
Digital Data Processing with Floating Point Graphics
Digital Data Network with Global Finance Integration
Financial Data Visualization Over Futuristic Cityscape
Premium
Stock market graph trading analysis investment financial, stock exchange financial or forex graph stock market graph chart business crisis crash loss and grow up gain and profits win up trend.
Digital Network with Financial and Business Icons in Interconnected Web
Global Network and Financial Data Visualization on Dark Background
Declining Stock Market Graph on Digital Background
Digital Finance Data Overlapping Urban Skyline
Premium
Analysis finance grow graph and market  investment. Financial  business plan,earnings,sale and strategy. Stock market chart, exchange financial growth diagram.
Global Finance Technology Concept with Spinning Icons
Dynamic Global Market Trends Over World Map Visualization
Cryptocurrency Data with Digital Analytics Overlay
European Market Data Overlay with EU Flag and Financial Graphs
Premium
Stock market or forex trading graph on touchscreen,  finance and investment concept. Economy trends for business, financial charts and digits.
Futuristic Digital Finance World Map with Dynamic Data
Digital Graph Representing Data Analysis and Technology
Digital Financial Data Analysis with Graphs and Charts Visualization
Cybernetic Data Flow with Digital Network Connections
Premium
Trader analyzing data on virtual screen.Price graph and indicator. Stock market invest and crypto currency. Stock market and business investment.
Abstract Digital Interface Over Black Background
Futuristic Digital Data Graphs and World Map
Global Financial Technology Network and Data Analytics
Futuristic Financial Data Analysis with Rising White Line Graph
Premium
graph stock market economics, chart growth business to success globally. concept of investment, plan strategy, increase profit, financial economy, and grow marketing. digital technology trend
Analyzing Financial Data with Business Charts Against Urban Skyline
Abstract Graphs Over Modern Building at Night
Dynamic Stock Market Graph on Digital Interface
Dynamic Financial Data with Overlaid Cityscape Interface
Premium
hand show graph chart stock market economic. growth business concept. plan strategy company increase profit to success global. trend marketing grows technology digital. economy, financial, and invest
Abstract Data Network with Financial Analytics Overlay
Digital Brain Overlay with Financial Data Visualization
Dynamic Financial Data Analysis with Graph Overlays
Interconnected Network of Technological Media Icons on Dark Digital Background
Abstract Global Finance and Data Analysis Conceptual Visual
Abstract Global Financial Data and Digital Trading Interface
Premium
Businessman works on laptop Showing business analytics dashboard with charts, metrics, and KPI to analyze performance and create insight reports for operations management. Data analysis concept.Ai
Colorful Light Trails over Digital Data on Dark Background
Futuristic Data Processing Animation with Media Icons
Digital Data Analytics Overlay on Cityscape
Digital Financial Graph with Tech Symbols on Red Background
Premium
Businessman analyzing forex trading graph financial data. Stock Market Investments Funds and Digital Assets. Business finance technology and investment concept. Business finance background.
Dynamic Data Graphs on Digital Interface Background
Colorful Digital Connections and Global Networking Visualization
Digital Financial Data Graph Showcasing Market Trends
Abstract DNA Strands and Data Processing Visualization
Premium
Stock market graph trading analysis investment financial, stock exchange financial or forex graph stock market graph chart business crisis crash loss and grow up gain and profits win up trend
Digital Financial Data Processing with Glowing Indicators
Futuristic Digital Network with Data Streams and Connections
Digital Data Network with Financial and Business Icons
Digital Simulated Global Financial Data and Graphs
Premium
The 2025 new year business goals concept. Businessman touching increase arrow graph company future growth 2025. Business plan target strategy, Planning and challenge business strategy in new year,
Abstract Futuristic Data Network and Digital Finance Concept
Financial Data Analysis Overlaying Cityscape
Abstract Data Processing and Digital Analysis
Digital Network Connections with Financial Icons on Virtual Display
Premium
Businessman analyzing forex trading graph financial data. Business finance background.business finance technology and investment concept. Stock Market Investments Funds and Digital Assets.
Digital Data and Graph Integration in City Street Scene
Global Business Finance Data Analysis Visualization
Digital Stock Market Display with Data Analysis Graphics
Financial Data Visualization on Dark Background
Premium
Businessman using KPI dashboard.Financial business KPI System data analytics graph dashboard.Data System KPI and metrics connected in database for follow earnings,operations and sales data.
Modern Technology Network with Financial Data Visualization
Abstract Digital Data and Network Connections Background
Dynamic Financial Market Graph Amidst Digital Equations
Financial Data Analysis with Global Digital Interface
Abstract Financial Graph On Black Background Representing Data Analysis
Abstract Financial Market Data Analysis Visualization
Premium
Two diverse crypto traders brokers stock exchange market investors discussing trading charts research reports growth using pc computer looking at screen analyzing invest strategy, financial risks.
Digital Data Overlay on Urban Skyline Examining Global Business Trends
Futuristic Data Processing and Global Business Network
Global Data Analytics on Digital Grid Interface
Futuristic Stock Market Graph With Digital Overlay
Premium
Stock market graph trading analysis investment financial, stock exchange financial or forex graph stock market graph chart business crisis crash loss and grow up gain and profits win up trend
Dynamic Data Flow with Analytics Visuals on Grid
Financial Data Analysis Displayed on Server Infrastructure
Digital Data Processing on Global Technological Interface
Data Analysis in COVID-19 Medical Research with Molecular Visuals
Premium
Investors analyze graph data stock market index via digital tablet screen to trade the stock chart for planning investments take profit, trade stock exchange market and cryptocurrency data, financial.
Digital Financial Data Processing with Graphs and Charts
Dynamic Financial Data Visualization on Digital Grid Background
World Map with Digital Financial Data Visualization
Digital Financial Data Visual Representation on Blue Background
Premium
Business strategy development and growing growth plan.	
Financial management strategy for business growth.Graph and chart. Investment of growth on currency rate.
Financial Data Overlay on Scrolling Digital Stock Market Data
Futuristic Digital Waves Illustrating Complex Data Technology
Cybersecurity Digital Fingerprint with Network Connections
Data Visualization on Blue Digital Interface
Premium
Stock market chart,Stock market data on LED display concept.
Data Visualization on Digital Interface with Graphs and Codes
Tech Growth Analysis with Dynamic Data Visualization
Abstract Digital Data Visualization with Colorful Graphs
Digital Connectivity with Medical Icons on Dark Background
Premium
Stock market digital graph chart on LED display concept. A large display of daily stock market price and quotation. Indicator financial forex trade education background.
Financial Data Visualization with Digital Pulse and Charts