- Home >
- Stock Photos >
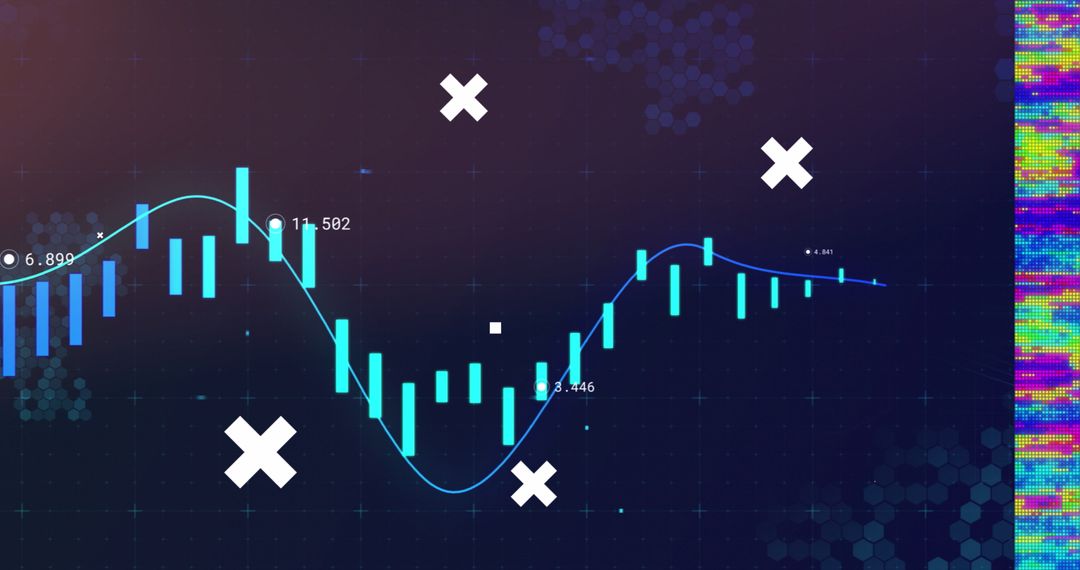
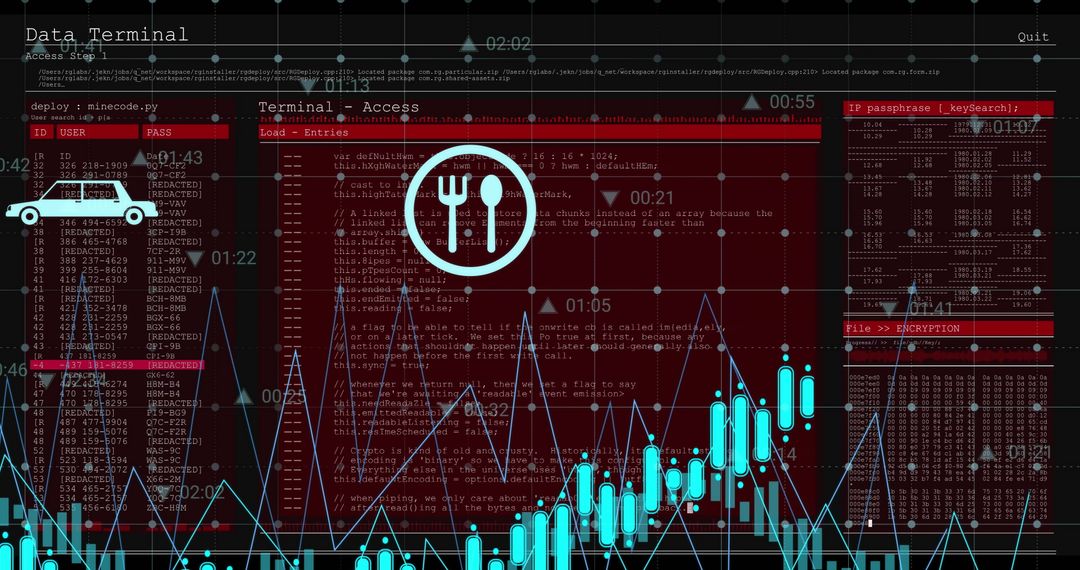
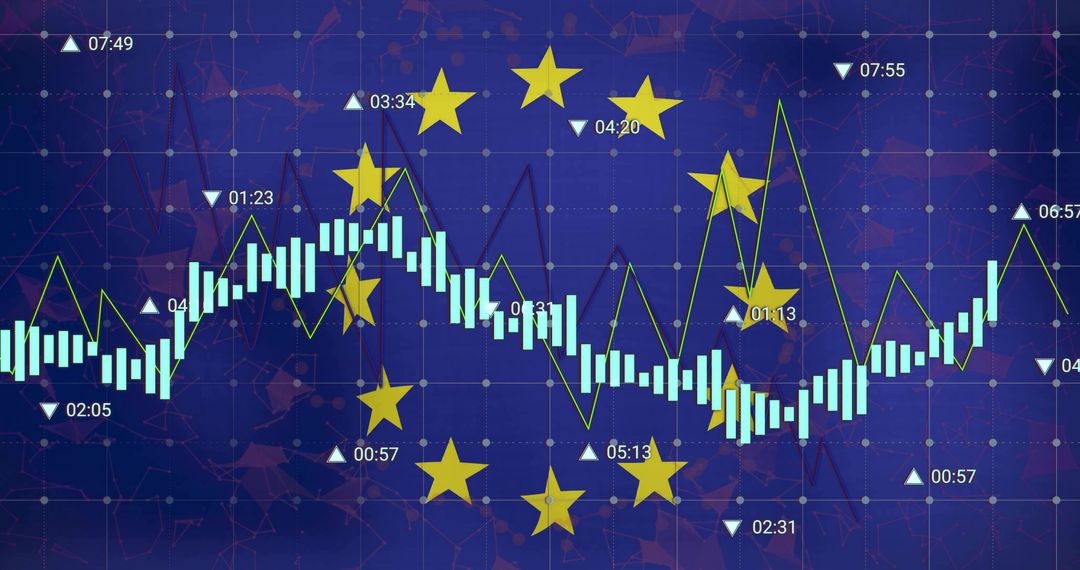
- Abstract Financial Data with Icon Integration on Blue Background
Abstract Financial Data with Icon Integration on Blue Background Image

This digital composition features financial data and various business icons against a blue background, highlighting the integration of digital technology and finance industry. Symbols such as a house, a lightbulb, and cutlery visualize industries impacted by financial trends. Suitable for illustrating topics on financial analysis, digital finance, technological advancement in business, or presentations about innovative trends in different sectors. Ideal for finance-related articles, banners, and educational materials to connect business and technology themes.
Powered by  - Get 15% off with code: PIKWIZARD15


2
downloads
downloads
Tags:
More
Credit Photo
If you would like to credit the Photo, here are some ways you can do so
Text Link
photo Link
<span class="text-link">
<span>
<a target="_blank" href=https://pikwizard.com/photo/abstract-financial-data-with-icon-integration-on-blue-background/dd18d2d7a9326b1b803817f076105f91/>PikWizard</a>
</span>
</span>
<span class="image-link">
<span
style="margin: 0 0 20px 0; display: inline-block; vertical-align: middle; width: 100%;"
>
<a
target="_blank"
href="https://pikwizard.com/photo/abstract-financial-data-with-icon-integration-on-blue-background/dd18d2d7a9326b1b803817f076105f91/"
style="text-decoration: none; font-size: 10px; margin: 0;"
>
<img src="https://pikwizard.com/pw/medium/dd18d2d7a9326b1b803817f076105f91.jpg" style="margin: 0; width: 100%;" alt="" />
<p style="font-size: 12px; margin: 0;">PikWizard</p>
</a>
</span>
</span>
Free (free of charge)
Free for personal and commercial use.
Author: Creative Art
Similar Free Stock Images
Premium


Premium


Premium


Premium


Premium


Premium


Premium


Premium


Premium


Premium


Premium


Premium


Premium


Premium


Premium


Premium


Premium


Premium


Premium


Premium


Premium


Premium


Premium


Premium