- Home >
- Stock Photos >
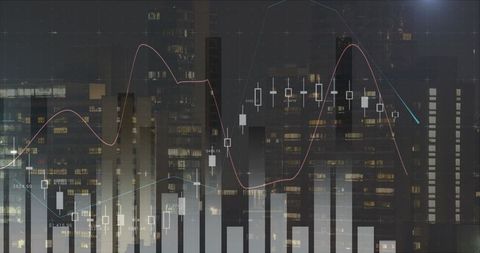
- Abstract Financial Data with Line Graph and Bars
Abstract Financial Data with Line Graph and Bars Image

Visualization of various financial data represents trends and metrics like in stock market analysis or financial reporting. Useful for illustrating concepts within technology or finance articles and presentations.

downloads
Tags:
More
Credit Photo
If you would like to credit the Photo, here are some ways you can do so
Text Link
photo Link
<span class="text-link">
<span>
<a target="_blank" href=https://pikwizard.com/photo/abstract-financial-data-with-line-graph-and-bars/fcffb23a02aa08e749f4f89749348e98/>PikWizard</a>
</span>
</span>
<span class="image-link">
<span
style="margin: 0 0 20px 0; display: inline-block; vertical-align: middle; width: 100%;"
>
<a
target="_blank"
href="https://pikwizard.com/photo/abstract-financial-data-with-line-graph-and-bars/fcffb23a02aa08e749f4f89749348e98/"
style="text-decoration: none; font-size: 10px; margin: 0;"
>
<img src="https://pikwizard.com/pw/medium/fcffb23a02aa08e749f4f89749348e98.jpg" style="margin: 0; width: 100%;" alt="" />
<p style="font-size: 12px; margin: 0;">PikWizard</p>
</a>
</span>
</span>
Free (free of charge)
Free for personal and commercial use.
Author: People Creations