- Home >
- Stock Photos >
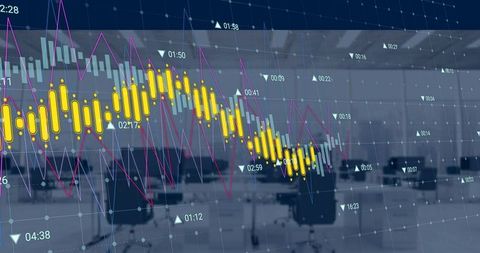
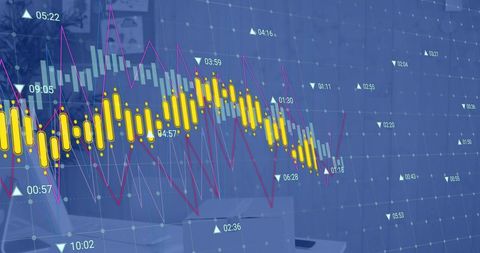
- Abstract Financial Data with Mathematical Equations on Blue Background
Abstract Financial Data with Mathematical Equations on Blue Background Image

Colorful abstract representation of financial data processing with charts and equations overlayed on blue background. Suited for illustrating finance, global business analytics, stock market trends, or any digital financial interface concepts. Useful in professional presentations, fintech websites, or educational materials focusing on data science or economics.
Powered by 


downloads
Tags:
More
Credit Photo
If you would like to credit the Photo, here are some ways you can do so
Text Link
photo Link
<span class="text-link">
<span>
<a target="_blank" href=https://pikwizard.com/photo/abstract-financial-data-with-mathematical-equations-on-blue-background/9224a7fa07197f6b361f36395a49cd81/>PikWizard</a>
</span>
</span>
<span class="image-link">
<span
style="margin: 0 0 20px 0; display: inline-block; vertical-align: middle; width: 100%;"
>
<a
target="_blank"
href="https://pikwizard.com/photo/abstract-financial-data-with-mathematical-equations-on-blue-background/9224a7fa07197f6b361f36395a49cd81/"
style="text-decoration: none; font-size: 10px; margin: 0;"
>
<img src="https://pikwizard.com/pw/medium/9224a7fa07197f6b361f36395a49cd81.jpg" style="margin: 0; width: 100%;" alt="" />
<p style="font-size: 12px; margin: 0;">PikWizard</p>
</a>
</span>
</span>
Free (free of charge)
Free for personal and commercial use.
Author: People Creations
Similar Free Stock Images
Loading...

Premium


Premium


Premium

Premium


Premium


Premium

Premium


Premium

Premium

Premium


Premium


Premium


Premium


Premium


Premium


Premium


Premium


Premium

Premium


Premium


Premium

Premium


Premium


Premium


Premium