- Home >
- Stock Photos >
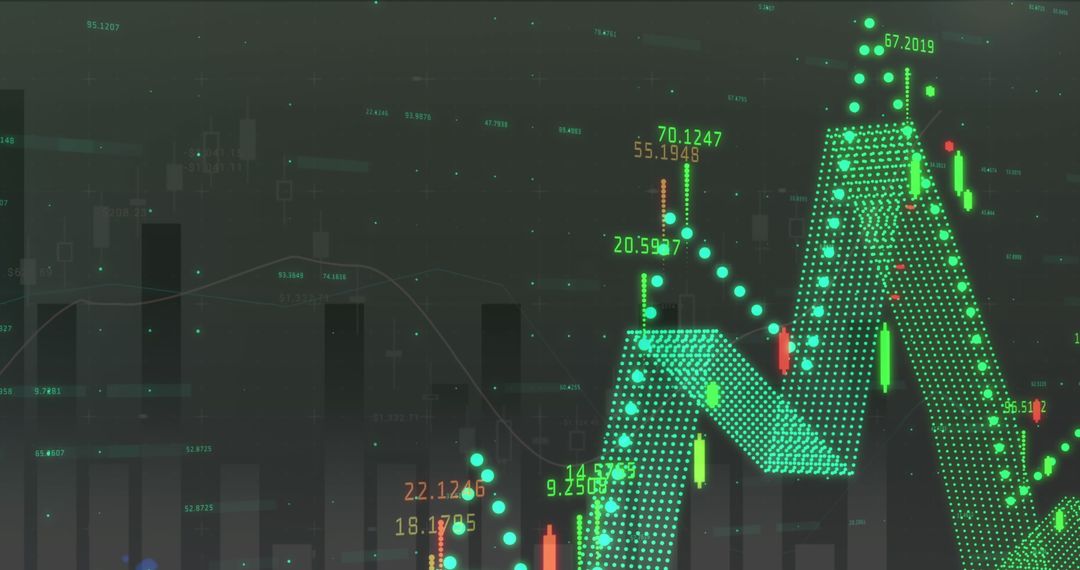
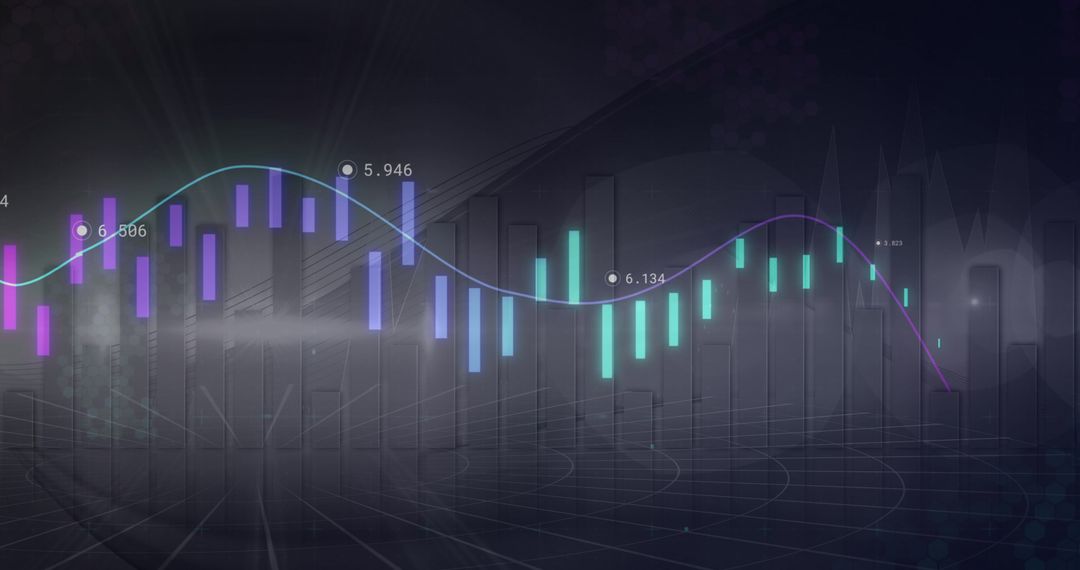
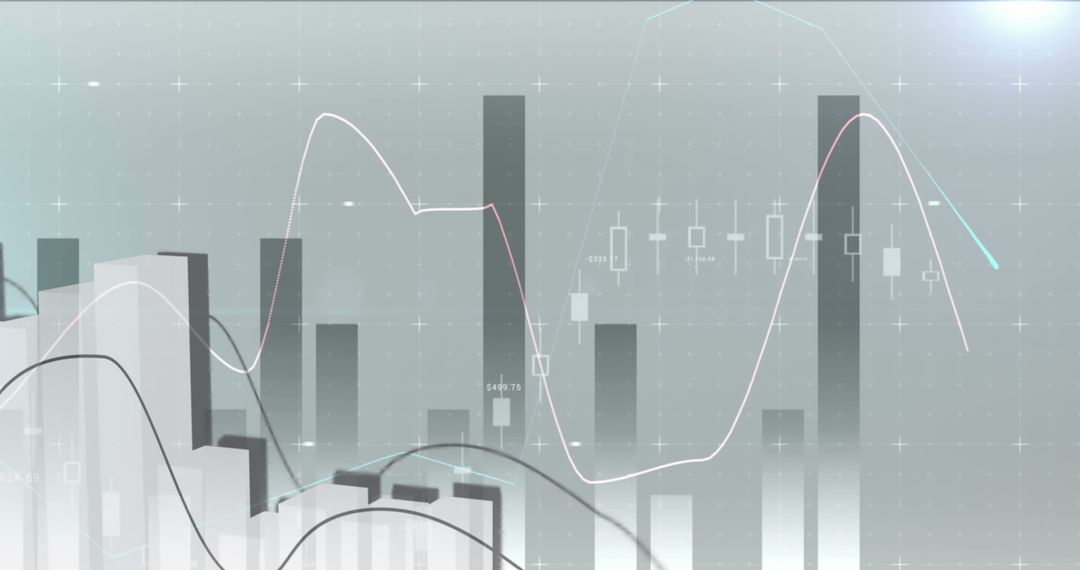
- Abstract Financial Data with Neon Line Graph and Candlestick Chart
Abstract Financial Data with Neon Line Graph and Candlestick Chart Image

Abstract illustration features financial data visualization with neon accents on a gray background. Highlights digital interface specifics related to stock market analytics. Suitable for presentations in finance sectors or digital analysis tools ads.
Powered by 


2
downloads
downloads
Tags:
More
Credit Photo
If you would like to credit the Photo, here are some ways you can do so
Text Link
photo Link
<span class="text-link">
<span>
<a target="_blank" href=https://pikwizard.com/photo/abstract-financial-data-with-neon-line-graph-and-candlestick-chart/ad5d450f77e4f4d7573d78777ca90429/>PikWizard</a>
</span>
</span>
<span class="image-link">
<span
style="margin: 0 0 20px 0; display: inline-block; vertical-align: middle; width: 100%;"
>
<a
target="_blank"
href="https://pikwizard.com/photo/abstract-financial-data-with-neon-line-graph-and-candlestick-chart/ad5d450f77e4f4d7573d78777ca90429/"
style="text-decoration: none; font-size: 10px; margin: 0;"
>
<img src="https://pikwizard.com/pw/medium/ad5d450f77e4f4d7573d78777ca90429.jpg" style="margin: 0; width: 100%;" alt="" />
<p style="font-size: 12px; margin: 0;">PikWizard</p>
</a>
</span>
</span>
Free (free of charge)
Free for personal and commercial use.
Author: Awesome Content
Similar Free Stock Images

Premium


Premium


Premium


Premium


Premium


Premium


Premium


Premium


Premium


Premium


Premium


Premium


Premium


Premium


Premium


Premium


Premium


Premium


Premium


Premium


Premium


Premium


Premium


Premium