
- Home >
- Stock Photos >
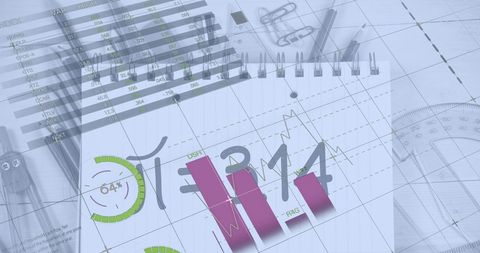
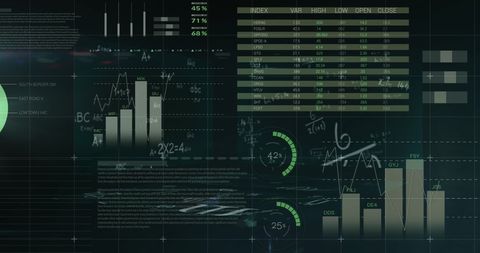
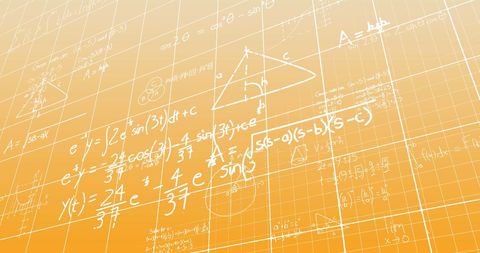
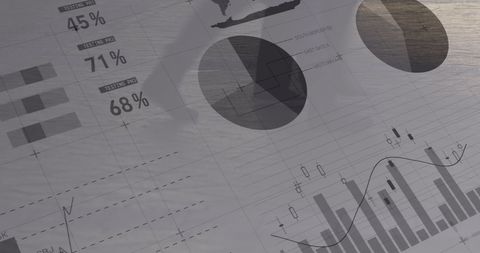
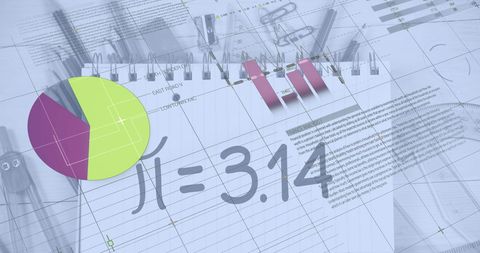
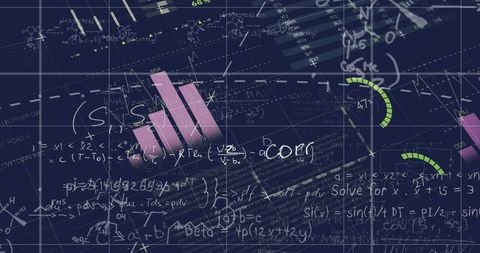
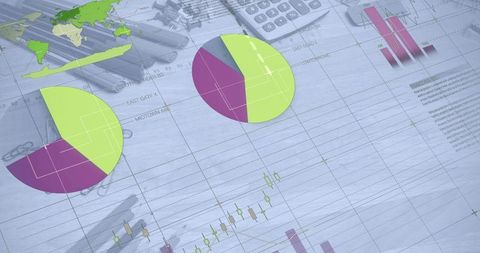
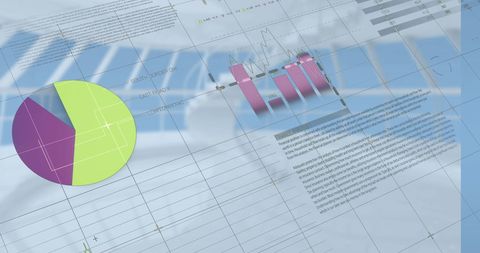
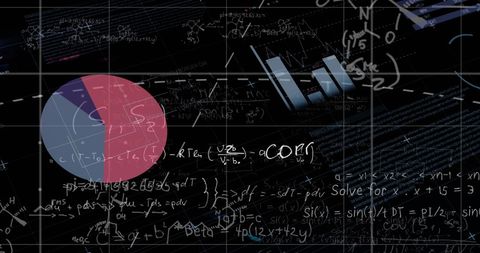
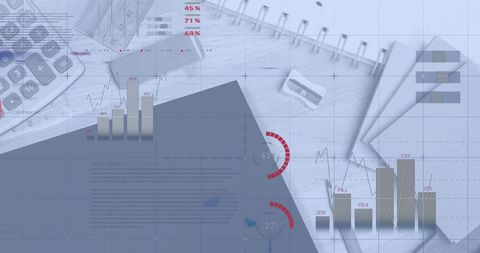
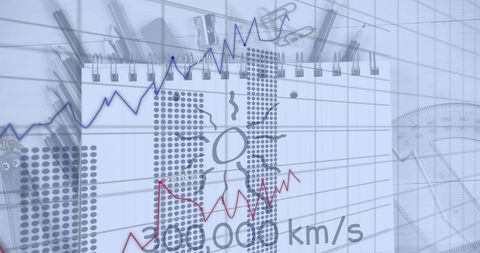
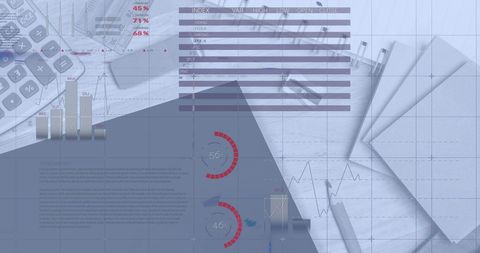
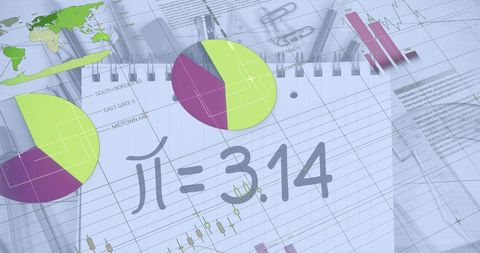
- Abstract Financial Data with Network and Equation Elements
Abstract Financial Data with Network and Equation Elements Image
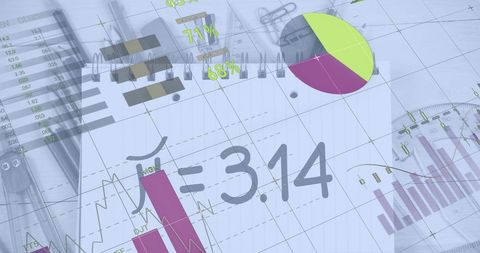
Illustrates a fusion of financial market elements and mathematical references, showcasing an abstract, futuristic theme. Useful for presentations on financial analysis, technology integration in business, educational content related to mathematics or finance. Ideal for emphasizing data analysis concepts.
Powered by 


downloads
Tags:
More
Credit Photo
If you would like to credit the Photo, here are some ways you can do so
Text Link
photo Link
<span class="text-link">
<span>
<a target="_blank" href=https://pikwizard.com/photo/abstract-financial-data-with-network-and-equation-elements/d65c5e69ee8032576e4efb026f54f0c4/>PikWizard</a>
</span>
</span>
<span class="image-link">
<span
style="margin: 0 0 20px 0; display: inline-block; vertical-align: middle; width: 100%;"
>
<a
target="_blank"
href="https://pikwizard.com/photo/abstract-financial-data-with-network-and-equation-elements/d65c5e69ee8032576e4efb026f54f0c4/"
style="text-decoration: none; font-size: 10px; margin: 0;"
>
<img src="https://pikwizard.com/pw/medium/d65c5e69ee8032576e4efb026f54f0c4.jpg" style="margin: 0; width: 100%;" alt="" />
<p style="font-size: 12px; margin: 0;">PikWizard</p>
</a>
</span>
</span>
Free (free of charge)
Free for personal and commercial use.
Author: Authentic Images
Similar Free Stock Images

Premium


Premium


Premium


Premium


Premium


Premium


Premium


Premium


Premium


Premium


Premium


Premium

Premium

Premium


Premium


Premium


Premium

Premium


Premium


Premium


Premium

Premium


Premium

Premium


Premium


Explore More Free Stock Images