- Home >
- Stock Photos >
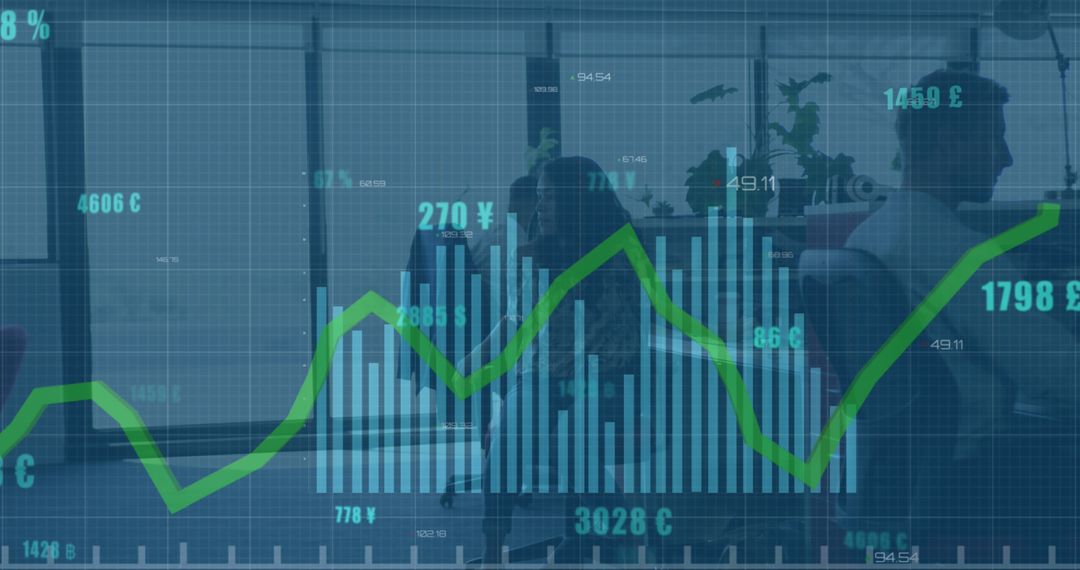
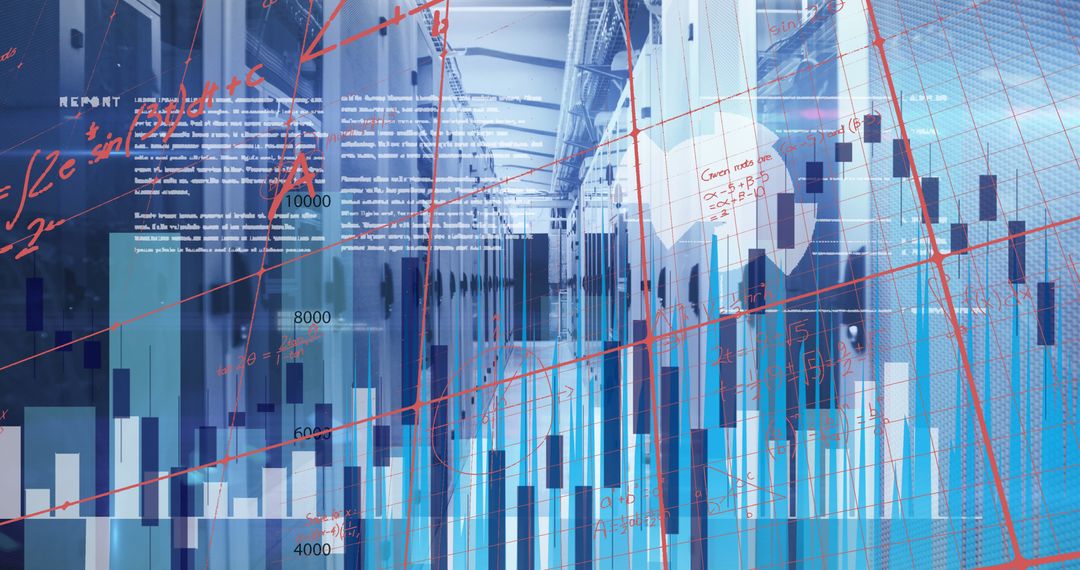
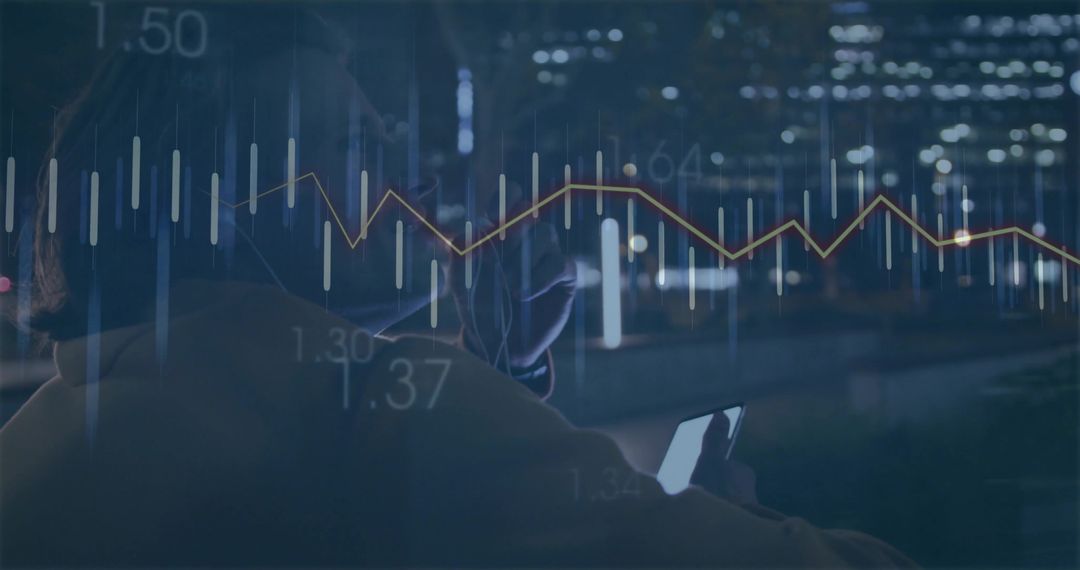
- Abstract Financial Data with Server Room Overlay and Charts
Abstract Financial Data with Server Room Overlay and Charts Image

This depicts abstract financial data overlaying a server room image. Charts and graphs represent dynamics of economic data. Use for financial reports, market analysis presentations, or digital business themes.
Powered by 


2
downloads
downloads
Tags:
More
Credit Photo
If you would like to credit the Photo, here are some ways you can do so
Text Link
photo Link
<span class="text-link">
<span>
<a target="_blank" href=https://pikwizard.com/photo/abstract-financial-data-with-server-room-overlay-and-charts/f57d0723b885c3cbe641927ce3aabd9c/>PikWizard</a>
</span>
</span>
<span class="image-link">
<span
style="margin: 0 0 20px 0; display: inline-block; vertical-align: middle; width: 100%;"
>
<a
target="_blank"
href="https://pikwizard.com/photo/abstract-financial-data-with-server-room-overlay-and-charts/f57d0723b885c3cbe641927ce3aabd9c/"
style="text-decoration: none; font-size: 10px; margin: 0;"
>
<img src="https://pikwizard.com/pw/medium/f57d0723b885c3cbe641927ce3aabd9c.jpg" style="margin: 0; width: 100%;" alt="" />
<p style="font-size: 12px; margin: 0;">PikWizard</p>
</a>
</span>
</span>
Free (free of charge)
Free for personal and commercial use.
Author: Creative Art
Similar Free Stock Images

Premium


Premium


Premium


Premium


Premium


Premium


Premium


Premium


Premium


Premium


Premium


Premium


Premium


Premium


Premium


Premium


Premium


Premium


Premium


Premium


Premium


Premium


Premium


Premium