
- Home >
- Stock Photos >
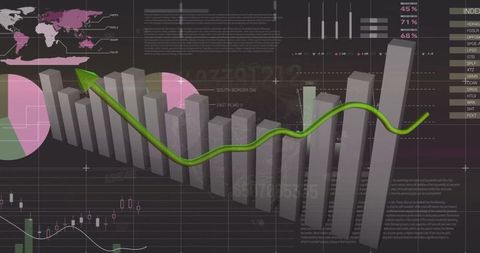
- Abstract Financial Data with White Graph Against Dark Blue Background
Abstract Financial Data with White Graph Against Dark Blue Background Image

This abstract image of financial data features a mix of white bars and line graphs overlaid on a dark blue background or a 'grid-like' view of digital numbers and cities, symbolizing data analysis and business growth. Appropriate for websites or marketing materials related to finance, economics, global business trends, data analysis and digitization efforts. Perfect for slides, blog posts, or presentations focused on analyzing complex financial information and strategic planning.
Powered by  - Get 15% off with code: PIKWIZARD15


2
downloads
downloads
Tags:
More
Credit Photo
If you would like to credit the Photo, here are some ways you can do so
Text Link
photo Link
<span class="text-link">
<span>
<a target="_blank" href=https://pikwizard.com/photo/abstract-financial-data-with-white-graph-against-dark-blue-background/60366ea61cc9d7f1ebeddabd7f2f6b80/>PikWizard</a>
</span>
</span>
<span class="image-link">
<span
style="margin: 0 0 20px 0; display: inline-block; vertical-align: middle; width: 100%;"
>
<a
target="_blank"
href="https://pikwizard.com/photo/abstract-financial-data-with-white-graph-against-dark-blue-background/60366ea61cc9d7f1ebeddabd7f2f6b80/"
style="text-decoration: none; font-size: 10px; margin: 0;"
>
<img src="https://pikwizard.com/pw/medium/60366ea61cc9d7f1ebeddabd7f2f6b80.jpg" style="margin: 0; width: 100%;" alt="" />
<p style="font-size: 12px; margin: 0;">PikWizard</p>
</a>
</span>
</span>
Free (free of charge)
Free for personal and commercial use.
Author: Creative Art
Similar Free Stock Images
Loading...

Premium


Premium

Premium

Premium


Premium

Premium


Premium


Premium


Premium


Premium


Premium


Premium


Premium


Premium


Premium


Premium

Premium

Premium


Premium


Premium


Premium

Premium


Premium


Premium
Premium
