
- Home >
- Stock Photos >
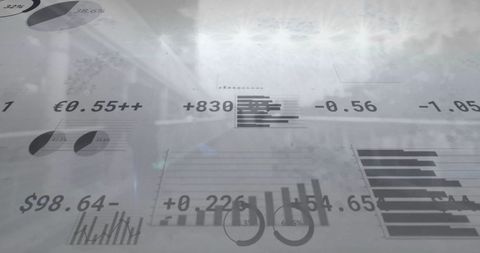
- Abstract Financial Forecast with Overlapping Numerals
Abstract Financial Forecast with Overlapping Numerals Image

This image creatively displays overlapping numeric values, suggesting financial predictions and complex data analysis. The diagonal alignment and translucency of numbers enhance the abstract and futuristic feel. Useful for illustrating concepts related to economic forecasts, financial reports, data analysis services, and discussions on technology-imposed transformations in statistical analysis.
Powered by  - Get 15% off with code: PIKWIZARD15


downloads
Tags:
More
Credit Photo
If you would like to credit the Photo, here are some ways you can do so
Text Link
photo Link
<span class="text-link">
<span>
<a target="_blank" href=https://pikwizard.com/photo/abstract-financial-forecast-with-overlapping-numerals/03477eb0ad5f0022d024672bdfddcaee/>PikWizard</a>
</span>
</span>
<span class="image-link">
<span
style="margin: 0 0 20px 0; display: inline-block; vertical-align: middle; width: 100%;"
>
<a
target="_blank"
href="https://pikwizard.com/photo/abstract-financial-forecast-with-overlapping-numerals/03477eb0ad5f0022d024672bdfddcaee/"
style="text-decoration: none; font-size: 10px; margin: 0;"
>
<img src="https://pikwizard.com/pw/medium/03477eb0ad5f0022d024672bdfddcaee.jpg" style="margin: 0; width: 100%;" alt="" />
<p style="font-size: 12px; margin: 0;">PikWizard</p>
</a>
</span>
</span>
Free (free of charge)
Free for personal and commercial use.
Author: People Creations
Similar Free Stock Images

Premium


Premium


Premium


Premium


Premium


Premium


Premium


Premium


Premium

Premium

Premium


Premium


Premium


Premium


Premium


Premium


Premium

Premium


Premium


Premium


Premium


Premium

Premium


Premium


Premium


Explore More Free Stock Images