
- Home >
- Stock Photos >
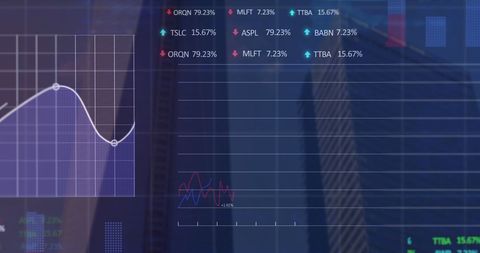
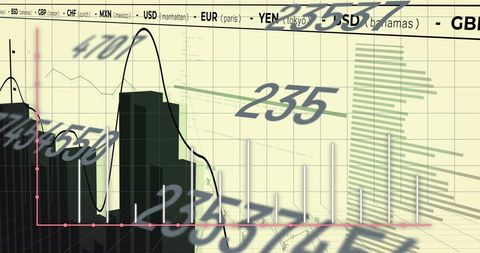
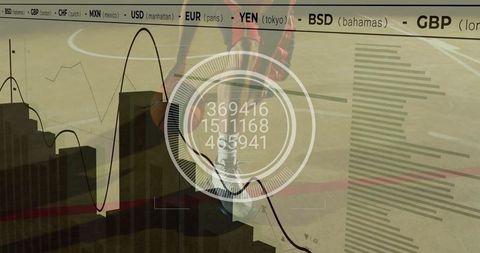
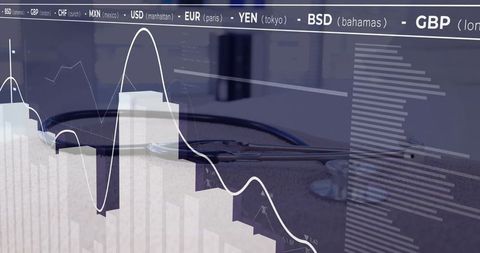
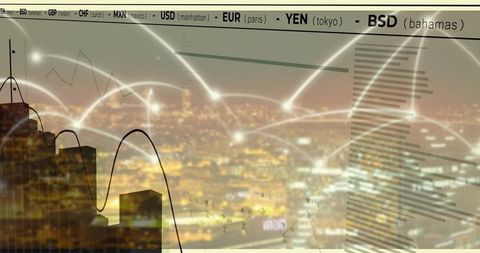
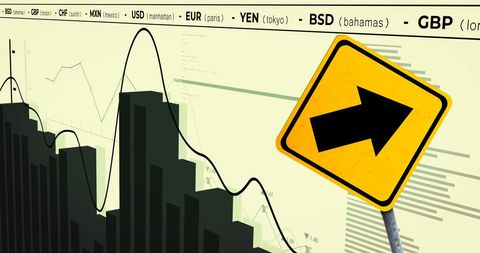
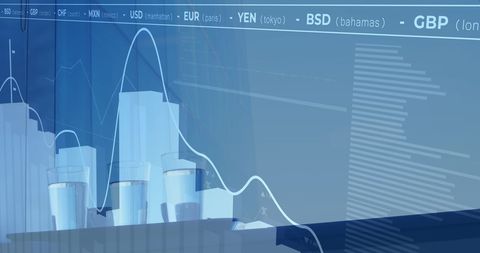
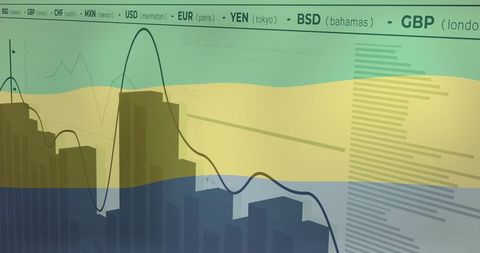
- Abstract Financial Graph Analysis Global Currencies Overlay
Abstract Financial Graph Analysis Global Currencies Overlay Image
Graph analysis combines 3D bar charts and line graphs on windowed backdrop, ideal for visuals illustrating financial trends, stock market behaviors, or economic transformations. Suitable for presentations, reports, or educational material exploring macroeconomic issues or investments.
Powered by 


downloads
Tags:
More
Credit Photo
If you would like to credit the Photo, here are some ways you can do so
Text Link
photo Link
<span class="text-link">
<span>
<a target="_blank" href=https://pikwizard.com/photo/abstract-financial-graph-analysis-global-currencies-overlay/f7e15cbac2d16916bf387e5d4b002194/>PikWizard</a>
</span>
</span>
<span class="image-link">
<span
style="margin: 0 0 20px 0; display: inline-block; vertical-align: middle; width: 100%;"
>
<a
target="_blank"
href="https://pikwizard.com/photo/abstract-financial-graph-analysis-global-currencies-overlay/f7e15cbac2d16916bf387e5d4b002194/"
style="text-decoration: none; font-size: 10px; margin: 0;"
>
<img src="https://pikwizard.com/pw/medium/f7e15cbac2d16916bf387e5d4b002194.jpg" style="margin: 0; width: 100%;" alt="" />
<p style="font-size: 12px; margin: 0;">PikWizard</p>
</a>
</span>
</span>
Free (free of charge)
Free for personal and commercial use.
Author: People Creations
Similar Free Stock Images
Loading...

Premium


Premium


Premium


Premium


Premium

Premium


Premium


Premium


Premium


Premium


Premium


Premium


Premium


Premium


Premium


Premium


Premium


Premium


Premium


Premium


Premium


Premium


Premium


Premium


Premium


Explore More Free Stock Images