- Home >
- Stock Photos >
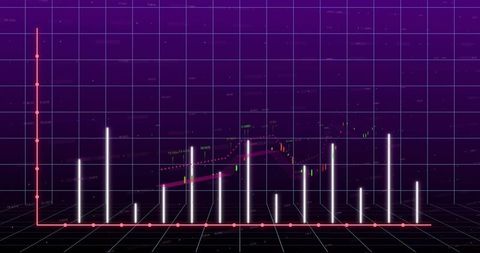
- Abstract Financial Graph Illustration on Dark Background
Abstract Financial Graph Illustration on Dark Background Image

Vibrant abstract illustration depicting a financial graph on a deep navy background. The use of orange and blue vertical bars suggests fluctuation in financial data. Suitable for portraying concepts related to finance, statistical analysis, economic trends, and technology advancements in presentations, reports, and educational materials.
Powered by 


downloads
Tags:
More
Credit Photo
If you would like to credit the Photo, here are some ways you can do so
Text Link
photo Link
<span class="text-link">
<span>
<a target="_blank" href=https://pikwizard.com/photo/abstract-financial-graph-illustration-on-dark-background/2af136a5ff3ae5579d9966f1ebddde46/>PikWizard</a>
</span>
</span>
<span class="image-link">
<span
style="margin: 0 0 20px 0; display: inline-block; vertical-align: middle; width: 100%;"
>
<a
target="_blank"
href="https://pikwizard.com/photo/abstract-financial-graph-illustration-on-dark-background/2af136a5ff3ae5579d9966f1ebddde46/"
style="text-decoration: none; font-size: 10px; margin: 0;"
>
<img src="https://pikwizard.com/pw/medium/2af136a5ff3ae5579d9966f1ebddde46.jpg" style="margin: 0; width: 100%;" alt="" />
<p style="font-size: 12px; margin: 0;">PikWizard</p>
</a>
</span>
</span>
Free (free of charge)
Free for personal and commercial use.
Author: Authentic Images
Similar Free Stock Images
Loading...

Premium


Premium

Premium


Premium


Premium


Premium


Premium

Premium

Premium


Premium


Premium


Premium


Premium


Premium


Premium


Premium


Premium


Premium


Premium


Premium


Premium


Premium

Premium


Premium


Premium