1. Home > 
  2. Stock Photos > 
  3. Abstract Financial Graph Overlay on Urban Map Grid Interface

Abstract Financial Graph Overlay on Urban Map Grid Interface Image

Abstract Financial Graph Overlay on Urban Map Grid Interface

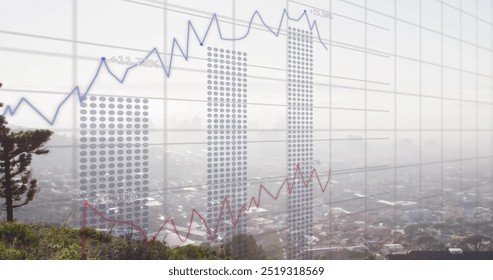
Candlestick charts combine with urban street maps to illustrate data trends and modern analytics. Useful in financial visualizations presentations, technology-themed projects, and interfaces displaying investment data analytics.

Powered by Shutterstock logo - Get 15% off with code: PIKWIZARD15
Image of multiple graphs, map and loading bars over aerial view of modern buildings against sky. Digital composite, multiple exposure, report, business, progress, global and architecture concept. - Powered by Shutterstock - Get 15% off with code: PIKWIZARD15Displaying data overlay over urban facades, showing pie charts, bar charts, line graph, world map. Futuristic, analytic, corporate, sleek, modernization, technology, data-driven - Powered by Shutterstock - Get 15% off with code: PIKWIZARD15Overlaying financial charts, world map and code snippets onto nighttime street with light trails. Urban, skyline, data, analytics, technology, metropolis, digital - Powered by Shutterstock - Get 15% off with code: PIKWIZARD15Displaying financial data overlaying urban skyline at dusk, with bar graphs, line charts and map. Futuristic, urban, digital, analytics, financial, technology, data visualization - Powered by Shutterstock - Get 15% off with code: PIKWIZARD15City skyline merged with financial charts and world map in glowing digital hologram style on abstract light background, concept of technology and business - Powered by Shutterstock - Get 15% off with code: PIKWIZARD15

Credit Photo

If you would like to credit the Photo, here are some ways you can do so

Free (free of charge)

Free for personal and commercial use.

Author: Creative Art

Similar Free Stock Images

Dynamic Financial Data with Global Analytics Concepts
Premium
Displaying city skyline showing neon data overlays at urban business district, with HUD elements. Metropolitan, data visualization, futuristic, analytics, technology, corporate, innovation
Dynamic Digital Financial Chart with Market Trends and Data Analysis
Premium
Image of graphs, numbers, lens flares and map over low angle view of building. Digital composite, multiple exposure, illuminated, report, finance, business, growth, global and technology.
Premium
Image of multiple graphs and map over modern buildings against sky. Digital composite, multiple exposure, report, business, global, database, abstract and architecture concept.
Financial Data Processing with Global Business Analytics
Paris Architecture Illuminated by Financial Market Trends Overlay
Abstract Financial Data Visualization on Digital Screens
Digital Cyber Attack and Data Analysis with Graph Visualization
Digital Graphs and Financial Data Overlaying Cityscape
Data Processing with Graphs on Computer Servers Concept
Dynamic Financial Graphs Illustrating Market Trends and Data
Digital Charts Highlighting Global Finance Data Insights
Dynamic Financial Data Analysis Charts with Green Digital Grid
Abstract Digital Financial Data with Graphs and Charts
Digital Financial Data Display with Graphs and Statistics
Financial Data Overlay with Business Growth Charts in Modern Cityscape
Global Financial Data and Digital Interface Concepts
Abstract Financial Graphs Overlapping Data Center
DNA Strands on Stock Chart Digital Interface
Digital Data Visualization with Futuristic Infographics
Premium
Multi exposure of virtual abstract financial diagram on blurry office buildings background, banking and accounting concept
Premium
Double exposure of financial graph and world map on city veiw background. Concept of financial market research and analysis
Digital Financial Analysis with Graphs and Data Patterns
Cybersecurity Threats Impacting Global Financial Markets
Global Market Analysis Candlestick Chart with Data Overlay
Digital Stock Market Analysis with Financial Charts and Data Visualization
Premium
Aerial panoramic city view of Time Square area, Manhattan West Side and the Hudson River, New York city, USA. Forex graph hologram. The concept of internet trading, brokerage and fundamental analysis
Premium
Forex chart on cityscape with skyscrapers wallpaper double exposure. Financial research concept.
Premium
Forex graph on city view with skyscrapers background multi exposure. Financial analysis concept.
Dynamic Financial Analysis on Digital Trading Screen
Digital Network with Data Processing Concept
Global Data Analysis with Virus Imagery in Background
Financial Data and Stock Market Analysis
Global Financial Market Positive Trend Visualization
Digital Financial Data and Technology Visualization
Dynamic Stock Market Chart with Currency and Candlestick Graphs
Premium
Image of graphs, loading bars and map over modern cityscape against cloudy sky. Digital composite, multiple exposure, report, business, progress, global, buildings and architecture concept.
Premium
Displaying charts overlaying nighttime road, with candlestick bar line and circular segments. Financial analysis, data visualization, urban landscape, motion blur, digital graphics, technology, modern
Premium
Double exposure of virtual creative financial diagram on Chicago office buildings background, banking and accounting concept
Premium
Forex graph on city view with skyscrapers background double exposure. Financial analysis concept.
Financial Data and Graphs Overlaying Urban Cityscape
Financial Data Analysis with Detailed Stock Chart Visual
Futuristic Data Visualization Overlay on World Map
Dynamic Financial Data with Digital Business Interface
Premium
Financial graph on night city scape with tall buildings background double exposure. Analysis concept.
Abstract City Traffic Analytics with Data Overlay
Financial Data Trends on Stock Market Graph
Dynamic Financial Graphs on Digital Screen Displaying Market Trends
Futuristic Financial Data Display with Stock Market Analysis
Premium
Image of financial data processing over city. Global finance, business, connections, computing and data processing concept digitally generated image.
Futuristic Bitcoin 3D Symbol on Dynamic Trading Screen
Futuristic City Skyline with Financial Data Overlay
Financial Trading Terminal with Dynamic Data Visualization
Financial Data Overlay with Server Room Background
Night Highway Overpass with Dynamic Financial Chart Overlay
Digital Data Analytics Display with Global Business Interface
Abstract Financial Data Display with Analytical Graphs
Abstract Financial Data Analysis Graphs with Digital Interface
Virtual Network with Futuristic Digital Elements Overlay
Financial Trading Dashboard with Candlestick and Line Graphs
Financial Market Love: Red Hearts and Economic Graph Integration
3D Financial Chart with Candlestick Bars and Trend Lines
Abstract Waveform Data Visualization in Futuristic Digital Network
Premium
Displaying financial charts with world map overlay on grid window at modern office. Business, technology, data, analytics, visualization, urban, modern
Stock Market Graph Reflecting Financial Trends and Analysis
Futuristic Digital World Map with Streaming Code and Networks
Global Financial Data Processing with Network Visualization
Market Dashboard Showing Downward Arrow Over Candlestick Charts and Percentage Labels
Digital Trading Desk with Line Graphs Representing Market Trends
Financial Data Processing Overlay on Night Cityscape
Global Financial Data with Analytics Overlay Concept
Dynamic Financial Data and Arrows with Technology Interface
Digital Economy Visualization With Graphs and Technology Overlay
Futuristic Graphs Over Cityscapes Indicating Global Financial Data Trends
Abstract Digital Data Grid With Programming Codes
Dynamic Stock Market Data on Digital Display
Futuristic Global Data Analytics with Blue World Map Overlay
Premium
A businessman in a dark tech environment uses a digital pen to draw a glowing smart real estate line graph, symbolizing futuristic housing technology, data analytics, and property investment planning.
Premium
Image of financial data processing over landscape. Global finances, computing and digital interface concept digitally generated image.
Colorful Financial Data Display with Trend Lines and Graphs
Digital Interface with Scanning Lines and Data Symbols
Global Data Processing with Digital Interface on Green Background
Stock Market Charts and QR Code Hologram Over Grid Screen
Futuristic Finance Dashboard with Candlesticks and Data Network
Futuristic Financial Data Analysis with Global Technology Integration
Futuristic Analytics Dashboard with Graphs and Network Interface
Businesswoman Analyzing Financial Data on Laptop with Smartphone
Premium
Double exposure of abstract creative financial diagram and world map on San Francisco office buildings background, banking and accounting concept
Abstract Financial Data Over Cityscape Imagery
Digital Graphs Overlaying Cityscape Reflecting Economic Trends
Futuristic Digital Analytics with Trend Line and Grid Overlay
Global Financial Data Visualization Overlaying World Map
Premium
Double exposure of abstract financial graph with world map on office buildings background, forex and investment concept
Financial Data Visualization with Dynamic Graphical Analysis
Futuristic Financial Data and Technology Concept Design
Futuristic Financial Data Interface with Neon Scanner
3D Grid with Dynamic Financial Data Visualization
Futuristic Financial Analytics with Candlestick Trends and Neon Lights
Digital Financial Data Over City Office Building
Dynamic Financial Data Processing Showing Stock Market Interface
Composite of Financial Graphs and Code with City Night Traffic
Digital Financial Graph with Circuit Board Interface on Blue Background
Global Financial Data Analysis and Technology Trends
Dynamic Financial Market Charts with Price Swings
Premium
Image of diagrams and data processing over cityscape. Global business, city and digital interface concept, digitally generated image.
Premium
Forex graph on city view with skyscrapers background multi exposure. Financial analysis concept.
Premium
Multi exposure of virtual abstract financial graph interface on Los Angeles cityscape background, financial and trading concept
Dynamic Stock Market Chart with Shoe Icons Overlay
Soundwaves with Graph Overlays in Data Processing Concept
Energy and Finance Analysis at Dusk with Overlaid Data Visualization
Fluctuating Financial Stock Chart Display with Candlesticks
Premium
Double exposure of virtual creative financial diagram on blurry office buildings background, banking and accounting concept
Dynamic Financial Data Display Over Global Stock Market
Financial Data Overlay on Office Desk with Visible Growth Chart
Digital Financial Data on World Map Illustrating Global Market Trends
Vibrant Financial Display with Trend Lines and Candlestick Chart
Premium
Business collage with mail signs, graph and buildings.
Premium
Displaying dashboard on rooftop overlooking city, showing world map and financial visualizations. Technology, analytics, data, finance, visualization, urban, modern
Digital Financial Data Analysis with Global Business Concept
Rising Candlestick Chart on Dynamic Digital Financial Display
Dynamic Data Visualization on Technological Grid
Financial Market Trends Over City Lights Digital Interface Concept
Statistics and Data Processing with Graphs and Charts
Dynamic Stock Market Dashboard with Candlestick and Line Graphs
Explore More Free Stock Images