- Home >
- Stock Photos >
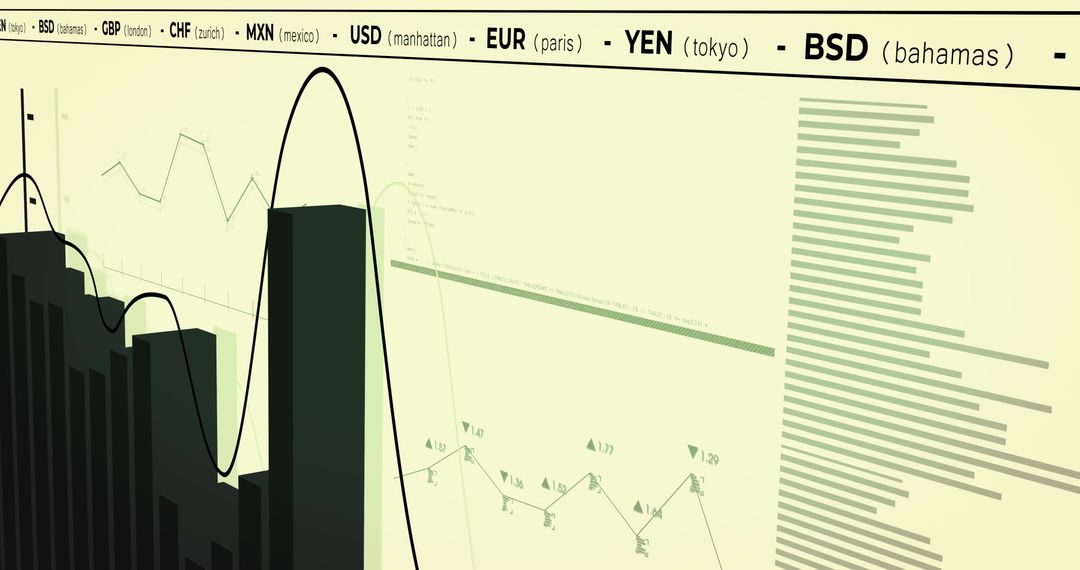
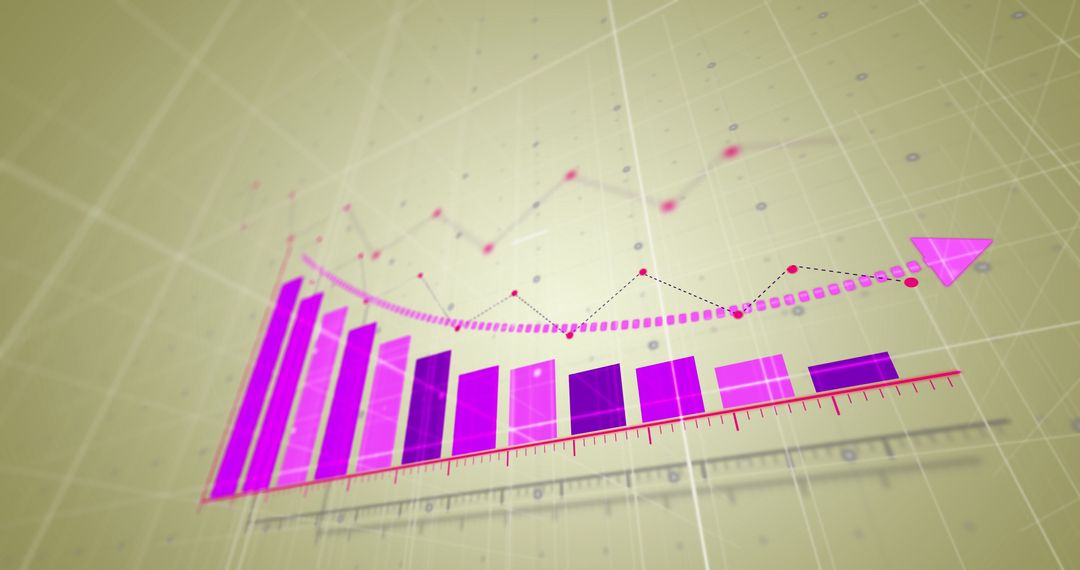
- Abstract Financial Graph Showing Digital Market Trends
Abstract Financial Graph Showing Digital Market Trends Image

Visual representation of statistical data processing overlaid on a grid network against a blue backdrop highlights digital data and market analyses. Useful for conveying concepts in business analytics, technological markets, economic forecasting, investment strategies, and cutting-edge digital technology representations. Ideal for financial websites, research presentations, and educational materials promoting technical methodologies in data interpretation.
Powered by 


2
downloads
downloads
Tags:
More
Credit Photo
If you would like to credit the Photo, here are some ways you can do so
Text Link
photo Link
<span class="text-link">
<span>
<a target="_blank" href=https://pikwizard.com/photo/abstract-financial-graph-showing-digital-market-trends/ac1d84255d19d479f5034ff85cb651aa/>PikWizard</a>
</span>
</span>
<span class="image-link">
<span
style="margin: 0 0 20px 0; display: inline-block; vertical-align: middle; width: 100%;"
>
<a
target="_blank"
href="https://pikwizard.com/photo/abstract-financial-graph-showing-digital-market-trends/ac1d84255d19d479f5034ff85cb651aa/"
style="text-decoration: none; font-size: 10px; margin: 0;"
>
<img src="https://pikwizard.com/pw/medium/ac1d84255d19d479f5034ff85cb651aa.jpg" style="margin: 0; width: 100%;" alt="" />
<p style="font-size: 12px; margin: 0;">PikWizard</p>
</a>
</span>
</span>
Free (free of charge)
Free for personal and commercial use.
Author: Awesome Content
Similar Free Stock Images

Premium


Premium


Premium


Premium


Premium


Premium


Premium


Premium


Premium


Premium


Premium


Premium


Premium


Premium


Premium


Premium


Premium


Premium


Premium


Premium


Premium


Premium


Premium


Premium