
- Home >
- Stock Photos >
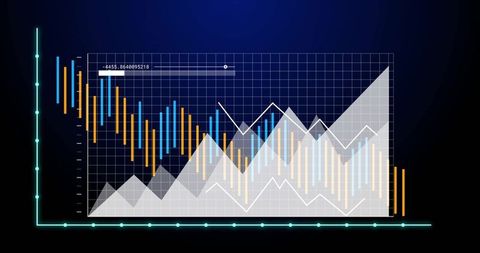
- Abstract Financial Graph with Bar and Line Charts on Dark Background
Abstract Financial Graph with Bar and Line Charts on Dark Background Image

Brightly colored financial graph showcasing bar and line charts on a sleek navy background illustrates economic or business trends. Ideal for presentations, reports, articles on economic forecasts, financial analyses or educational materials in economics, finance, and statistics fields.
Powered by  - Get 15% off with code: PIKWIZARD15


3
downloads
downloads
Tags:
More
Credit Photo
If you would like to credit the Photo, here are some ways you can do so
Text Link
photo Link
<span class="text-link">
<span>
<a target="_blank" href=https://pikwizard.com/photo/abstract-financial-graph-with-bar-and-line-charts-on-dark-background/d3d20aaa0678f0db9b8c5076caa1db6f/>PikWizard</a>
</span>
</span>
<span class="image-link">
<span
style="margin: 0 0 20px 0; display: inline-block; vertical-align: middle; width: 100%;"
>
<a
target="_blank"
href="https://pikwizard.com/photo/abstract-financial-graph-with-bar-and-line-charts-on-dark-background/d3d20aaa0678f0db9b8c5076caa1db6f/"
style="text-decoration: none; font-size: 10px; margin: 0;"
>
<img src="https://pikwizard.com/pw/medium/d3d20aaa0678f0db9b8c5076caa1db6f.jpg" style="margin: 0; width: 100%;" alt="" />
<p style="font-size: 12px; margin: 0;">PikWizard</p>
</a>
</span>
</span>
Free (free of charge)
Free for personal and commercial use.
Author: Creative Art
Similar Free Stock Images
Loading...

Premium


Premium


Premium


Premium


Premium


Premium


Premium

Premium

Premium


Premium


Premium


Premium


Premium


Premium

Premium

Premium


Premium


Premium


Premium


Premium


Premium


Premium


Premium


Premium


Premium
