- Home >
- Stock Photos >
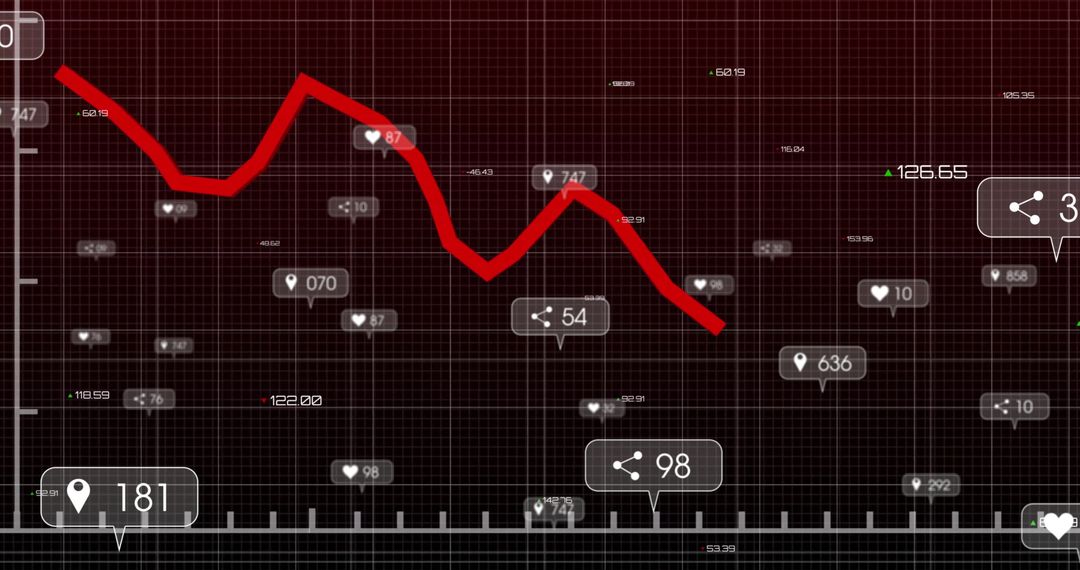
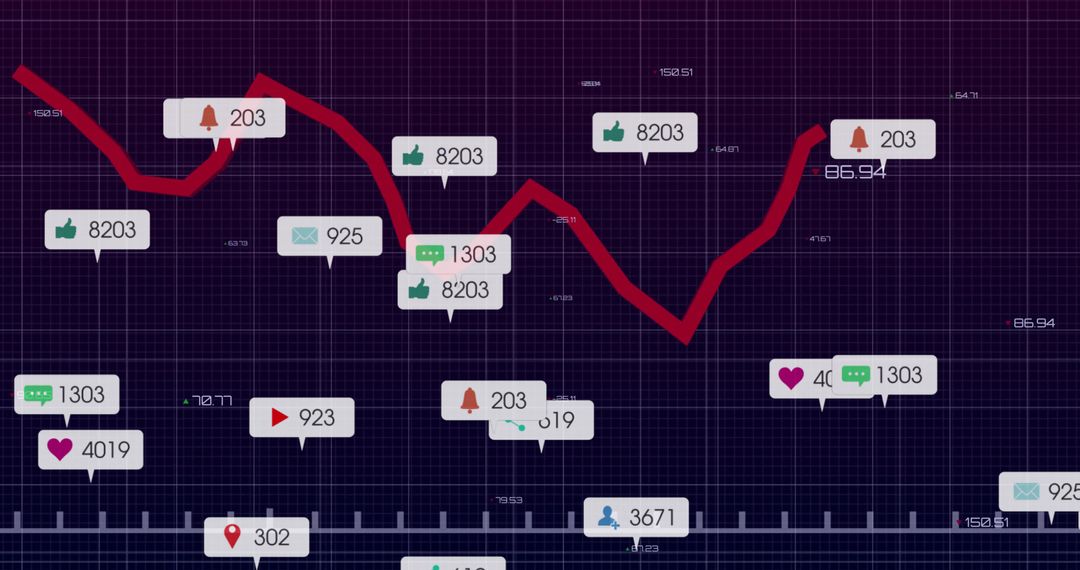
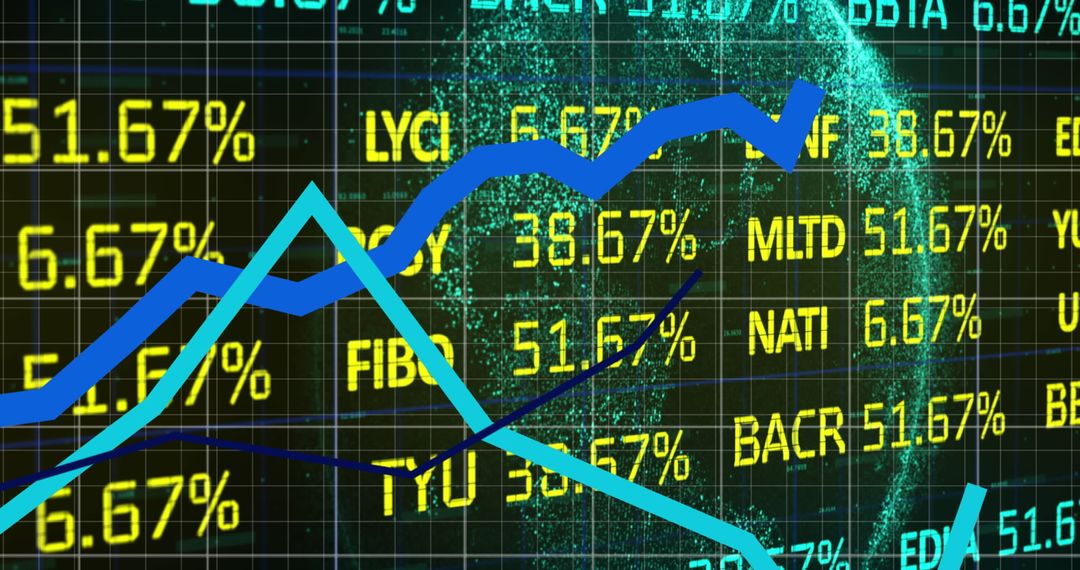
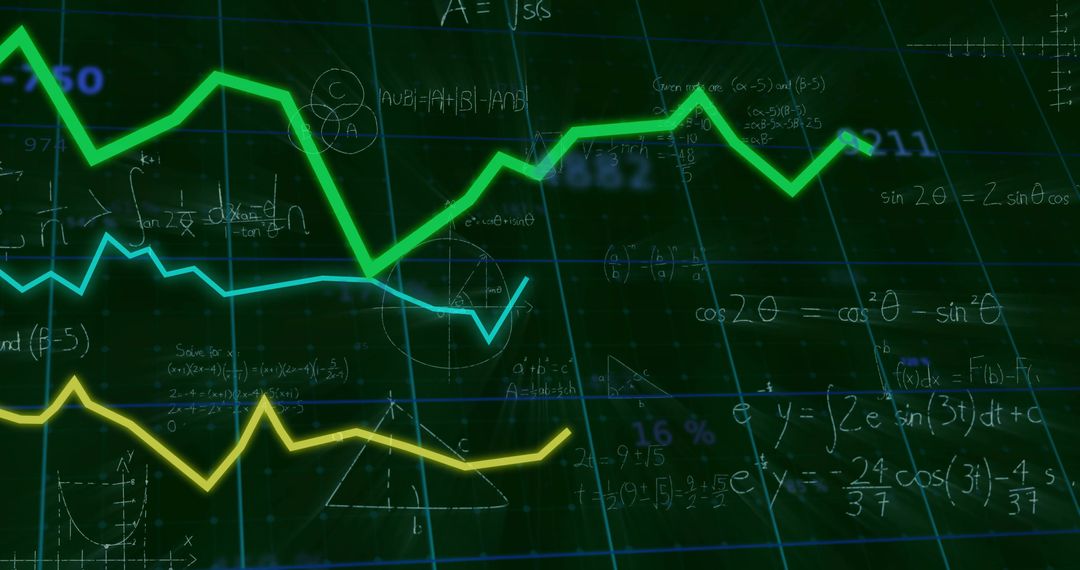
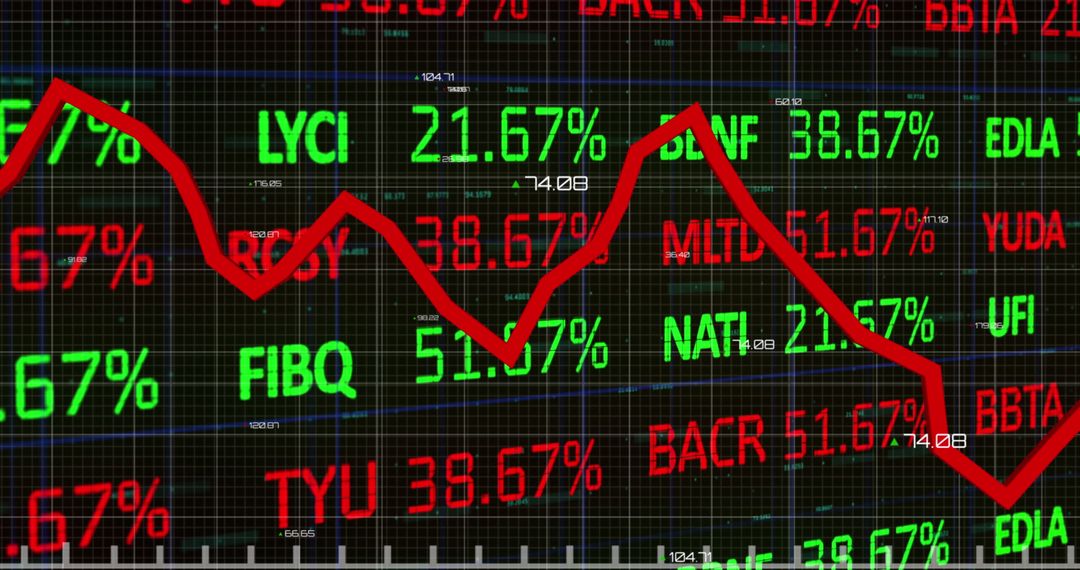
- Abstract Financial Graphs Displaying Market Trends
Abstract Financial Graphs Displaying Market Trends Image

Abstract financial and market graphs overlaid on black background exemplify digital finance and economic analytics. Useful for visualizing concepts in finance, economy, and technology-related presentations, articles, or educational materials depicting market fluctuations and trend analysis.
Powered by 


2
downloads
downloads
Tags:
More
Credit Photo
If you would like to credit the Photo, here are some ways you can do so
Text Link
photo Link
<span class="text-link">
<span>
<a target="_blank" href=https://pikwizard.com/photo/abstract-financial-graphs-displaying-market-trends/a9dfda8392b0317c2d1ccb58c670b36f/>PikWizard</a>
</span>
</span>
<span class="image-link">
<span
style="margin: 0 0 20px 0; display: inline-block; vertical-align: middle; width: 100%;"
>
<a
target="_blank"
href="https://pikwizard.com/photo/abstract-financial-graphs-displaying-market-trends/a9dfda8392b0317c2d1ccb58c670b36f/"
style="text-decoration: none; font-size: 10px; margin: 0;"
>
<img src="https://pikwizard.com/pw/medium/a9dfda8392b0317c2d1ccb58c670b36f.jpg" style="margin: 0; width: 100%;" alt="" />
<p style="font-size: 12px; margin: 0;">PikWizard</p>
</a>
</span>
</span>
Free (free of charge)
Free for personal and commercial use.
Author: People Creations
Similar Free Stock Images

Premium


Premium


Premium


Premium


Premium


Premium


Premium


Premium


Premium


Premium


Premium


Premium


Premium


Premium


Premium


Premium


Premium


Premium


Premium


Premium


Premium


Premium


Premium


Premium