- Home >
- Stock Photos >
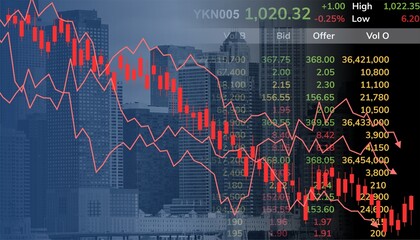
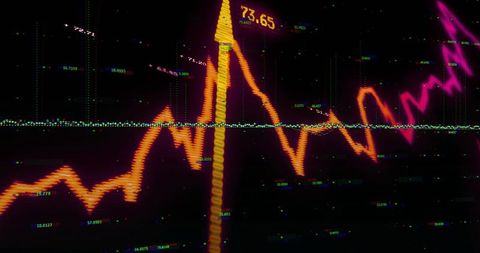
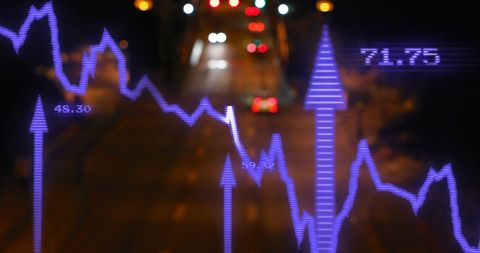
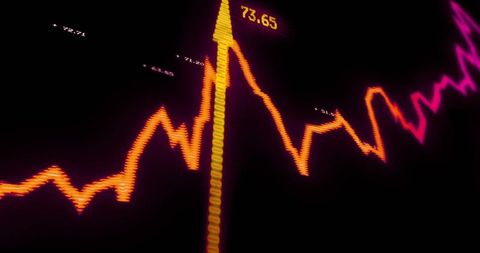
- Abstract Financial Graphs Illuminating Stock Market Trends
Abstract Financial Graphs Illuminating Stock Market Trends Image

This abstract visualization features bright, fluctuating graphs against a dark background, representing financial data and stock market trends. Perfect for use in presentations or content related to global economics, financial analysis, investor reports, and technology-driven data processing.
Powered by 


downloads
Tags:
More
Credit Photo
If you would like to credit the Photo, here are some ways you can do so
Text Link
photo Link
<span class="text-link">
<span>
<a target="_blank" href=https://pikwizard.com/photo/abstract-financial-graphs-illuminating-stock-market-trends/39c94976b53c8fdec85e0d47d86607c2/>PikWizard</a>
</span>
</span>
<span class="image-link">
<span
style="margin: 0 0 20px 0; display: inline-block; vertical-align: middle; width: 100%;"
>
<a
target="_blank"
href="https://pikwizard.com/photo/abstract-financial-graphs-illuminating-stock-market-trends/39c94976b53c8fdec85e0d47d86607c2/"
style="text-decoration: none; font-size: 10px; margin: 0;"
>
<img src="https://pikwizard.com/pw/medium/39c94976b53c8fdec85e0d47d86607c2.jpg" style="margin: 0; width: 100%;" alt="" />
<p style="font-size: 12px; margin: 0;">PikWizard</p>
</a>
</span>
</span>
Free (free of charge)
Free for personal and commercial use.
Author: People Creations
Similar Free Stock Images
Loading...

Premium


Premium


Premium


Premium


Premium


Premium


Premium


Premium


Premium

Premium


Premium


Premium


Premium

Premium


Premium


Premium


Premium


Premium


Premium


Premium


Premium


Premium


Premium


Premium


Premium