
- Home >
- Stock Photos >
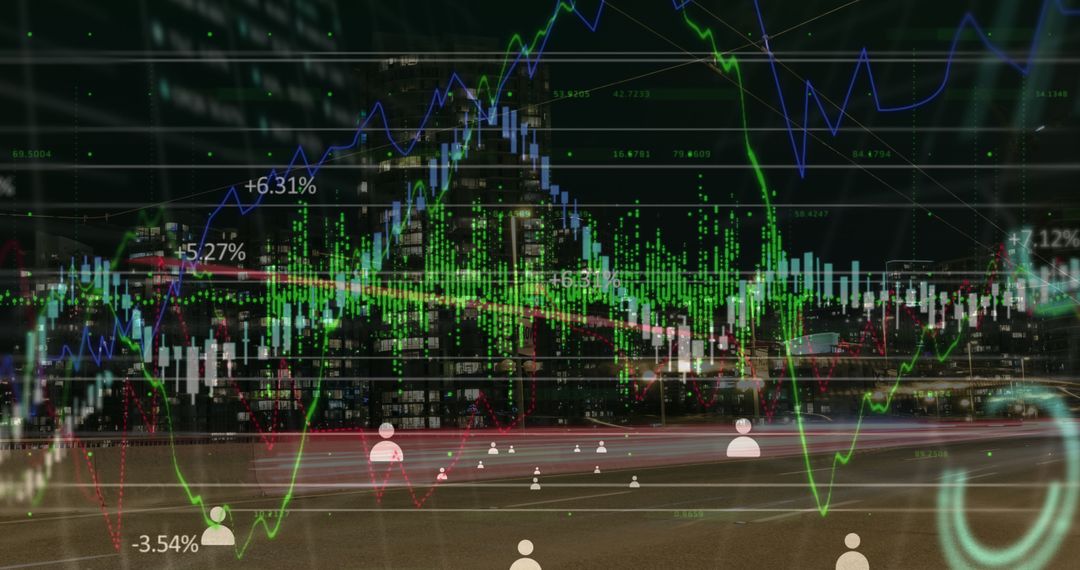
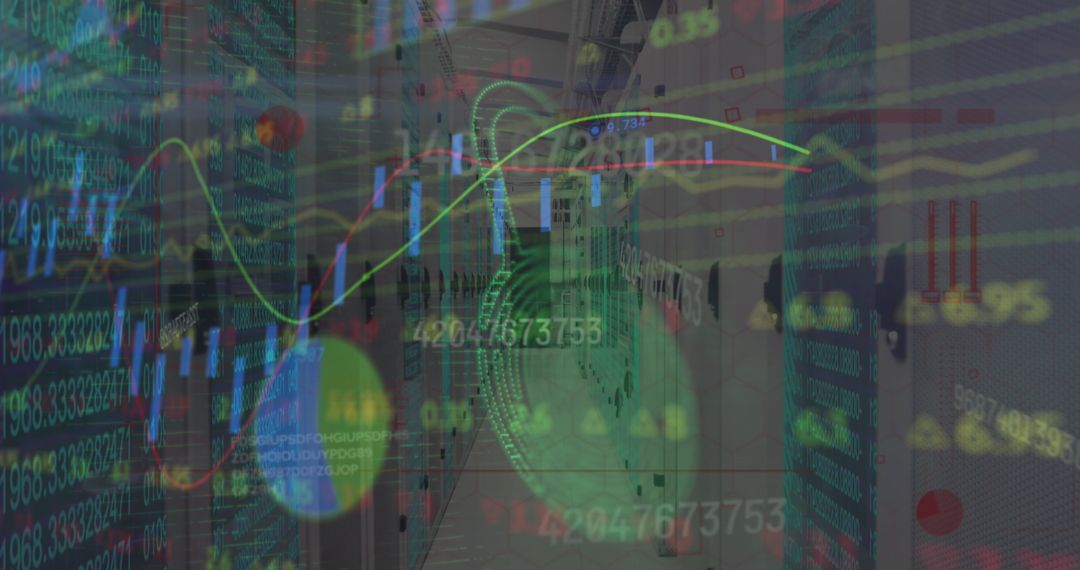
- Abstract Financial Graphs Overlapping Data Center
Abstract Financial Graphs Overlapping Data Center Image

High-tech imagery showcasing vibrant financial graphs superimposed on a server room while symbolizing digital economics and global financial analytics. Useful for illustrating concepts related to finance technology, data analytics, global business trends, and economic research.
Powered by 


2
downloads
downloads
Tags:
More
Credit Photo
If you would like to credit the Photo, here are some ways you can do so
Text Link
photo Link
<span class="text-link">
<span>
<a target="_blank" href=https://pikwizard.com/photo/abstract-financial-graphs-overlapping-data-center/9a74f979d134477bde23cf1c94529836/>PikWizard</a>
</span>
</span>
<span class="image-link">
<span
style="margin: 0 0 20px 0; display: inline-block; vertical-align: middle; width: 100%;"
>
<a
target="_blank"
href="https://pikwizard.com/photo/abstract-financial-graphs-overlapping-data-center/9a74f979d134477bde23cf1c94529836/"
style="text-decoration: none; font-size: 10px; margin: 0;"
>
<img src="https://pikwizard.com/pw/medium/9a74f979d134477bde23cf1c94529836.jpg" style="margin: 0; width: 100%;" alt="" />
<p style="font-size: 12px; margin: 0;">PikWizard</p>
</a>
</span>
</span>
Free (free of charge)
Free for personal and commercial use.
Author: People Creations
Similar Free Stock Images

Premium


Premium


Premium


Premium


Premium


Premium


Premium


Premium


Premium


Premium


Premium


Premium


Premium


Premium


Premium


Premium


Premium


Premium


Premium


Premium


Premium


Premium


Premium


Premium

