- Home >
- Stock Photos >
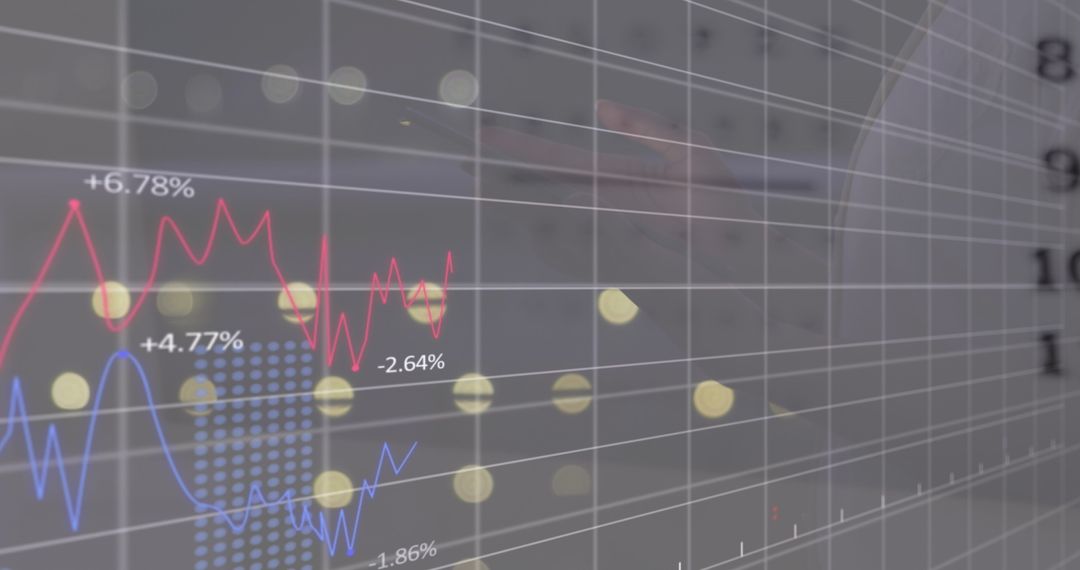
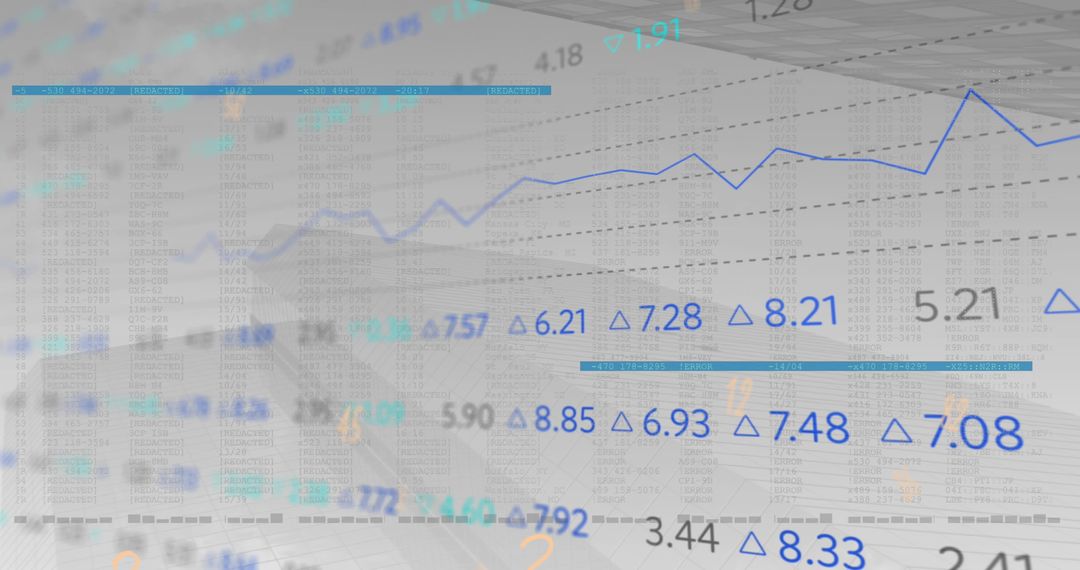
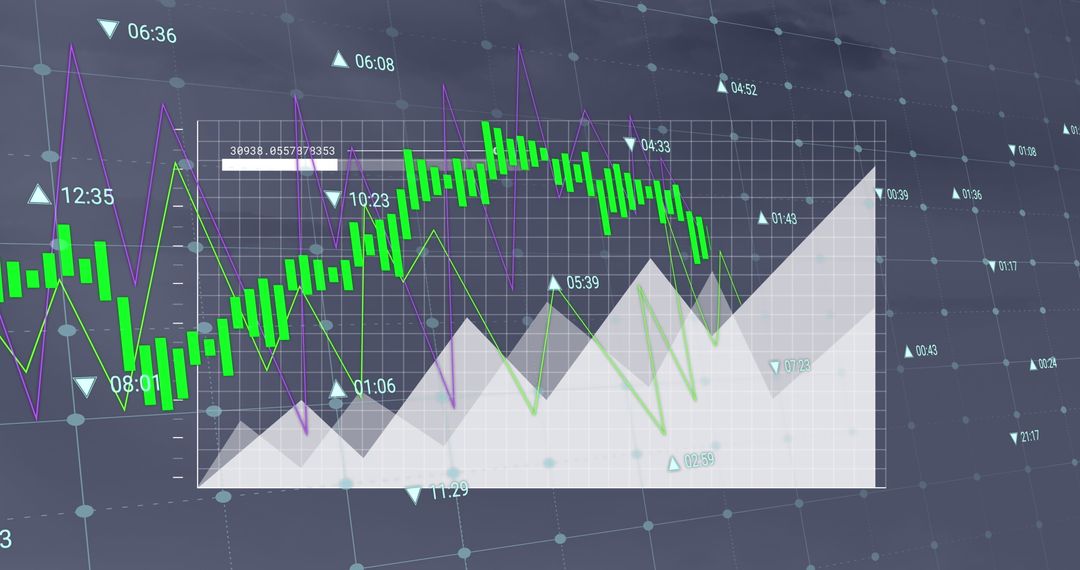
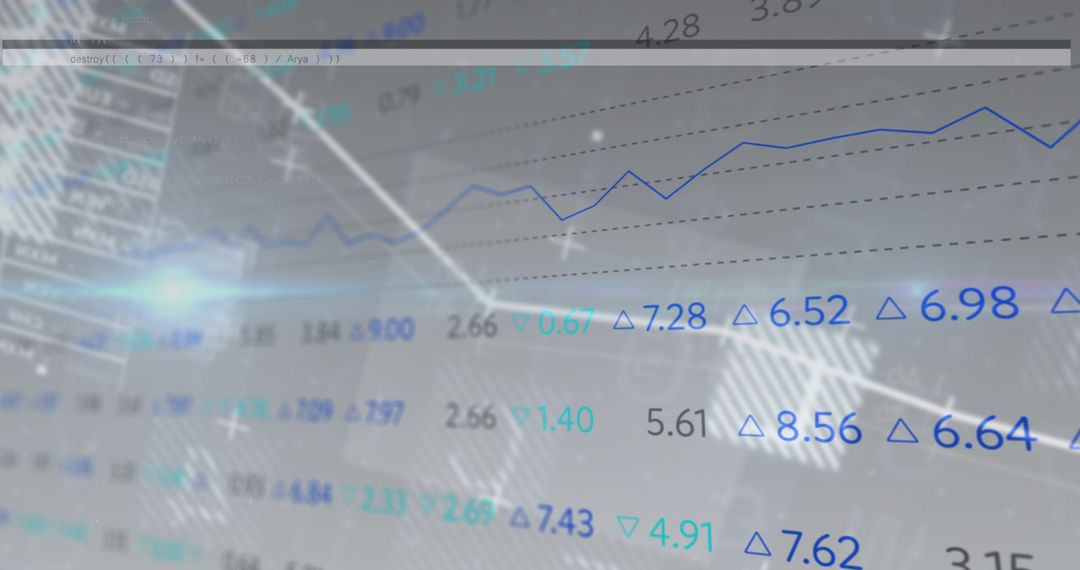
- Abstract Financial Graphs with Architectural Background
Abstract Financial Graphs with Architectural Background Image

Digital presentation of financial charts and data integrated with modern architectural structures. This combination evokes themes of global economics, business forecasting, and data-driven strategies. Ideal for illustrating concepts related to market analysis, technological advancements in finance, and the visualization of business growth analytics on corporate platforms, media publications, or educational materials.
Powered by 


2
downloads
downloads
Tags:
More
Credit Photo
If you would like to credit the Photo, here are some ways you can do so
Text Link
photo Link
<span class="text-link">
<span>
<a target="_blank" href=https://pikwizard.com/photo/abstract-financial-graphs-with-architectural-background/daed9f4199593f269a0d4081a07231e3/>PikWizard</a>
</span>
</span>
<span class="image-link">
<span
style="margin: 0 0 20px 0; display: inline-block; vertical-align: middle; width: 100%;"
>
<a
target="_blank"
href="https://pikwizard.com/photo/abstract-financial-graphs-with-architectural-background/daed9f4199593f269a0d4081a07231e3/"
style="text-decoration: none; font-size: 10px; margin: 0;"
>
<img src="https://pikwizard.com/pw/medium/daed9f4199593f269a0d4081a07231e3.jpg" style="margin: 0; width: 100%;" alt="" />
<p style="font-size: 12px; margin: 0;">PikWizard</p>
</a>
</span>
</span>
Free (free of charge)
Free for personal and commercial use.
Author: Awesome Content
Similar Free Stock Images

Premium


Premium


Premium


Premium


Premium


Premium


Premium


Premium


Premium


Premium


Premium


Premium


Premium


Premium


Premium


Premium


Premium


Premium


Premium


Premium


Premium


Premium


Premium


Premium