- Home >
- Stock Photos >
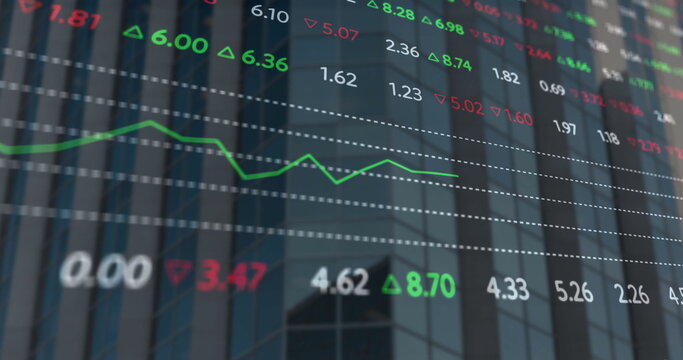
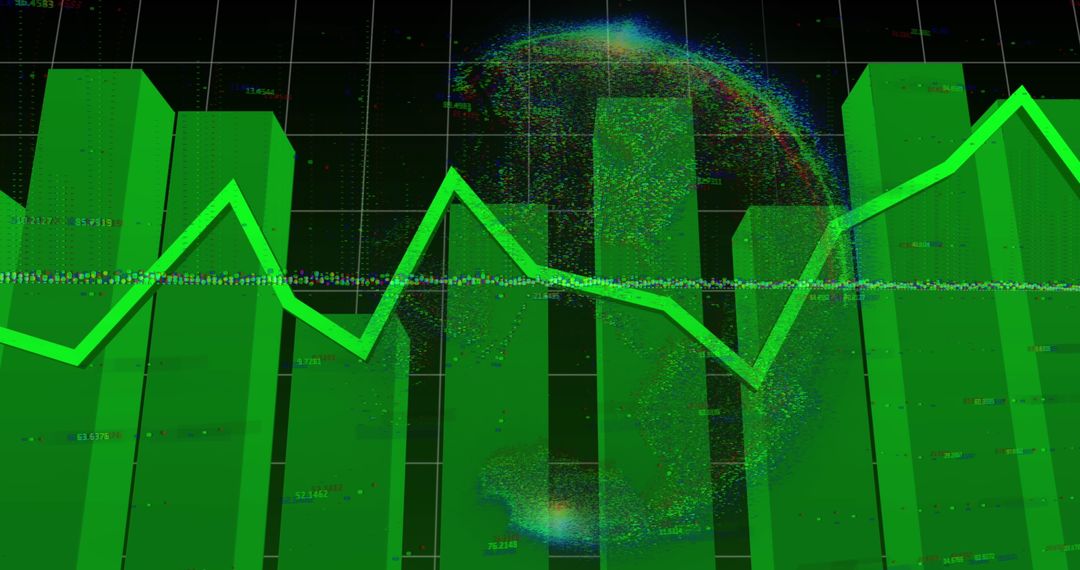
- Abstract Financial Graphs with Dynamic Green Trend Lines
Abstract Financial Graphs with Dynamic Green Trend Lines Image

Creative digital visualization depicting green financial graphs over dark background. Suitable for presentations, articles about market trends, financial analysis, or data reporting. Ideal for use in blogs focusing on economic growth, stock market trends, or digital innovation stories.
Powered by 


0
downloads
downloads
Tags:
More
Credit Photo
If you would like to credit the Photo, here are some ways you can do so
Text Link
photo Link
<span class="text-link">
<span>
<a target="_blank" href=https://pikwizard.com/photo/abstract-financial-graphs-with-dynamic-green-trend-lines/2b50ea75d863f5172f815976b6a9841a/>PikWizard</a>
</span>
</span>
<span class="image-link">
<span
style="margin: 0 0 20px 0; display: inline-block; vertical-align: middle; width: 100%;"
>
<a
target="_blank"
href="https://pikwizard.com/photo/abstract-financial-graphs-with-dynamic-green-trend-lines/2b50ea75d863f5172f815976b6a9841a/"
style="text-decoration: none; font-size: 10px; margin: 0;"
>
<img src="https://pikwizard.com/pw/medium/2b50ea75d863f5172f815976b6a9841a.jpg" style="margin: 0; width: 100%;" alt="" />
<p style="font-size: 12px; margin: 0;">PikWizard</p>
</a>
</span>
</span>
Free (free of charge)
Free for personal and commercial use.
Author: Creative Art
Similar Free Stock Images

Premium


Premium


Premium


Premium


Premium


Premium


Premium


Premium


Premium


Premium


Premium


Premium


Premium


Premium


Premium


Premium


Premium


Premium


Premium


Premium


Premium


Premium


Premium


Premium