- Home >
- Stock Photos >
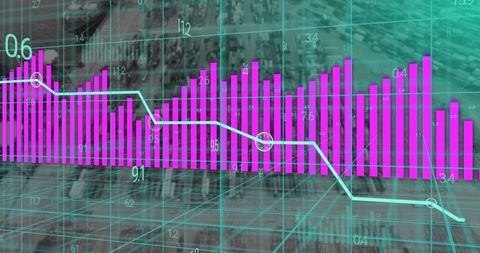
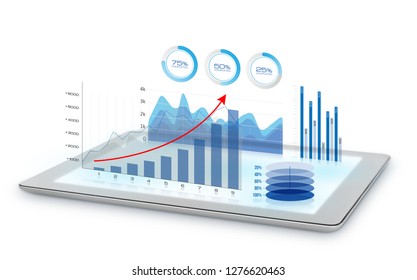
- Abstract Financial Growth Bar Graph on Pink Background
Abstract Financial Growth Bar Graph on Pink Background Image

Dynamic illustration of a growing financial bar graph set against a pink background, suggesting upward financial trends and progress. Suitable for presentations related to business growth, stock market analysis, financial reports, or any topic involving economic trends and future projections. The pink background adds a creative and modern flair, appealing to design-focused audiences.
Powered by  - Get 15% off with code: PIKWIZARD15


2
downloads
downloads
Tags:
More
Credit Photo
If you would like to credit the Photo, here are some ways you can do so
Text Link
photo Link
<span class="text-link">
<span>
<a target="_blank" href=https://pikwizard.com/photo/abstract-financial-growth-bar-graph-on-pink-background/d1e885731fd9233dd2557bc3e85c7ccf/>PikWizard</a>
</span>
</span>
<span class="image-link">
<span
style="margin: 0 0 20px 0; display: inline-block; vertical-align: middle; width: 100%;"
>
<a
target="_blank"
href="https://pikwizard.com/photo/abstract-financial-growth-bar-graph-on-pink-background/d1e885731fd9233dd2557bc3e85c7ccf/"
style="text-decoration: none; font-size: 10px; margin: 0;"
>
<img src="https://pikwizard.com/pw/medium/d1e885731fd9233dd2557bc3e85c7ccf.jpg" style="margin: 0; width: 100%;" alt="" />
<p style="font-size: 12px; margin: 0;">PikWizard</p>
</a>
</span>
</span>
Free (free of charge)
Free for personal and commercial use.
Author: Awesome Content
Similar Free Stock Images
Loading...

Premium


Premium

Premium


Premium

Premium


Premium
Premium

Premium

Premium


Premium


Premium


Premium


Premium

Premium

Premium


Premium


Premium

Premium
Premium


Premium


Premium

Premium


Premium


Premium

Premium