
- Home >
- Stock Photos >
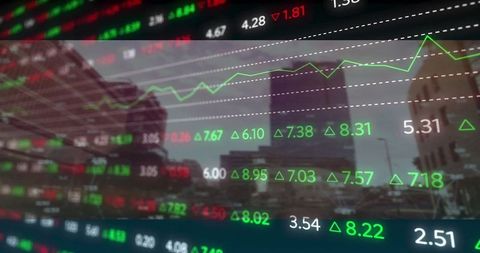
- Abstract Financial Interface with Data Visualization and Stock Charts
Abstract Financial Interface with Data Visualization and Stock Charts Image

This visual captures a futuristic financial interface featuring overlapping data visualization elements such as line charts, gauges, and stock market tickers. Ideal for illustrating themes around finance technology, stock trading, analytics, and modern data-driven environments. Useful for websites, presentations, and articles focused on financial sector innovations and digital transformation in fintech.
Powered by  - Get 15% off with code: PIKWIZARD15


downloads
Tags:
More
Credit Photo
If you would like to credit the Photo, here are some ways you can do so
Text Link
photo Link
<span class="text-link">
<span>
<a target="_blank" href=https://pikwizard.com/photo/abstract-financial-interface-with-data-visualization-and-stock-charts/de3126e74bbd6ca088b2758ca542a0cf/>PikWizard</a>
</span>
</span>
<span class="image-link">
<span
style="margin: 0 0 20px 0; display: inline-block; vertical-align: middle; width: 100%;"
>
<a
target="_blank"
href="https://pikwizard.com/photo/abstract-financial-interface-with-data-visualization-and-stock-charts/de3126e74bbd6ca088b2758ca542a0cf/"
style="text-decoration: none; font-size: 10px; margin: 0;"
>
<img src="https://pikwizard.com/pw/medium/de3126e74bbd6ca088b2758ca542a0cf.jpg" style="margin: 0; width: 100%;" alt="" />
<p style="font-size: 12px; margin: 0;">PikWizard</p>
</a>
</span>
</span>
Free (free of charge)
Free for personal and commercial use.
Author: People Creations
Similar Free Stock Images

Premium


Premium


Premium


Premium


Premium


Premium

Premium

Premium


Premium

Premium


Premium


Premium


Premium


Premium


Premium


Premium


Premium


Premium


Premium


Premium


Premium


Premium


Premium


Premium


Premium


Explore More Free Stock Images