1. Home > 
  2. Stock Photos > 
  3. Abstract Financial Market Analysis with Graph Overlay

Abstract Financial Market Analysis with Graph Overlay Image

Abstract Financial Market Analysis with Graph Overlay

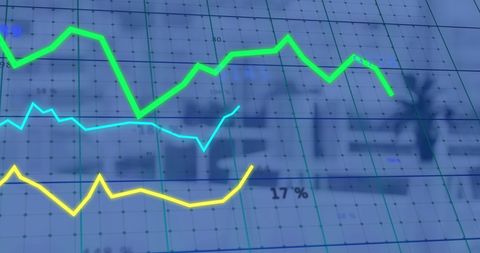
Brightly colored and dynamic graph overlay illustrating market trends over office equipments represents data analysis in an economic context. Perfect for use in business presentations, financial reports, or educational material on trading and market behavior.

Powered by Shutterstock logo - Get 15% off with code: PIKWIZARD15
Internet cyberspace data information collection analytical statistics computer storage ai artificial intelligence calculation, blue background banner copyspace. - Powered by Shutterstock - Get 15% off with code: PIKWIZARD15Two diverse crypto traders brokers stock exchange market investors discussing trading charts research reports growth using pc computer looking at screen analyzing invest strategy, financial risks. - Powered by Shutterstock - Get 15% off with code: PIKWIZARD15business documents on office table with smart phone and laptop computer and graph financial with social network diagram and three colleagues discussing data in the background - Powered by Shutterstock - Get 15% off with code: PIKWIZARD15Finance analyst working on business analytics and data management system to make financial report with business performance, KPI dashboard. Corporate strategy for finance, digital marketing plan - Powered by Shutterstock - Get 15% off with code: PIKWIZARD15Abstract glowing big data forex candlestick chart on blurry city backdrop. Trade, technology, investment and analysis concept. Double exposure - Powered by Shutterstock - Get 15% off with code: PIKWIZARD15

Credit Photo

If you would like to credit the Photo, here are some ways you can do so

Free (free of charge)

Free for personal and commercial use.

Author: People Creations

Similar Free Stock Images

Red Declining Graph on Digital Grid Display Represents Falling Markets
Premium
Analysis finance grow graph and market  investment. Financial  business plan,earnings,sale and strategy. Stock market chart, exchange financial growth diagram.
Financial Data Analysis with Growth Trend Arrows on Digital Interface
Dynamic Financial Market Trends with Data Visualizations
Financial Data Visualization with Rising Trends
World Map with Falling Line Graphs Indicating Global Economic Decline
Premium
Analyst working with Financial Report and Business Analytics Dashboard on laptop computer to analyze Financial Data with KPI and Metrics. Investment, Operations, Sales, Corporate Finance, Strategy.
Dynamic Financial Graph with Transparency Effect Overlay
Financial Data Visualizations Expert Economic Impact on Urban Skyline
Dynamic Stock Market Analytics Display on Blue Background
Dynamic Financial Graph on Digital Background
Premium
Stock market analysis, business, finance and investment. Finance analyst analyzing stock market trading graph, economic growth chart, planning and strategy, business investment with financial report
Futuristic Digital Interface with Dynamic Financial Graph
Social Media Activity Icons on Digital Graph
Dynamic Stock Market Graphs Over Digital Interface
Cityscape Overlay with Data Visualization
Premium
Stockmarket online trading chart candlestick on crypto currency platform. Stock exchange financial market price candles graph data pattern analysis concept. Computer screen closeup background
Business Women Analyzing Data in Office with Growth Chart Overlay
Dynamic Analysis of Stock Market Trends and Patterns
Financial Growth Graph and Data Analytics Representation
Dynamic Financial Data Analyzing with Graph Overlays
Premium
Business finance data analytics graph.Financial management technology.Advisor using KPI Dashboard on virtual screen.
Financial Data Graph Overlay on Modern Office Background
Digital Financial Graph Overlay on Urban Cityscape
Dynamic Stock Market Visual in Modern Office Setting
Dynamic Financial Data Graphs with Holographic Styles
Premium
Businessman using laptop computer analyzing sales data and financial growth graph chart report. Business planning, strategy and development. Financial accounting. market research, data analysis
Financial Data and Stock Market Trends Overlaying Cityscape
Financial Data Analysis with Growing Stock Trends
Financial Graph with Data Analysis and Market Statistics
Armenian Flag with Financial Graph Overlay Depicting Market Trends
Digital Financial Data Chart with Modern City Skyscrapers
Dynamic Digital Stock Market Ticker with Growing Graph Trends
Premium
Male mature caucasian ceo businessman leader with diverse coworkers team, executive managers group at meeting. Multicultural professional businesspeople working together on research plan in boardroom.
Analyzing Graph Showing Market Economy Stock Crisis
Energy Efficiency with Data Analytics and Smart Infrastructure
Global Economic Trends Highlighted on World Map with Graphs
Dynamic Green Stock Chart on Digital Grid Background
Premium
Mature older ceo businesswoman mentor in glasses negotiating growth business plan with diverse executive managers at boardroom meeting table using laptop. Multicultural team work together in office.
Dynamic Stock Market Data Visualization on Digital Screen
Financial Data Charts in Shimmering Blue Digital Space
Financial Growth Chart Overlay on City Skyline
Cityscape with Stock Market Digital Interface Overlay
Premium
Businessman using KPI dashboard.Financial business KPI System data analytics graph dashboard.Data System KPI and metrics connected in database for follow earnings,operations and sales data.
Financial Data Overlay on Urban Skyscrapers
Financial Market Growth Over City Skyline
Overlay of Financial Data on Business People in Office Building
Abstract Financial Graphs with Rising Trends and Positive Indicators
Premium
Professional analyzing financial data graphs, charts on laptop display at a modern workspace. Financial analysis or business evaluation concept
Colleagues Analyzing Financial Data on Digital Grid Interface
Financial Graphs with Social Media Analytics on Digital Chart
Dynamic Data Chart on Dark Digital Background
Networking Graph Overlay Data Server Room Visualization
Premium
Big data technology and data science. Data scientist querying, analysing and visualizing complex set on virtual screen. Data flow concept. Neural network, artificial intelligence, ML, analytics.
Dynamic Financial Data Against Urban Skyline
Dynamic Financial Graphs and Data Analysis Interface
Inflation Analytics: Graphic Representation of Stock Market Trends
Dynamic Stock Market Data and Cityscape Background
Premium
Focused latin hispanic young business woman working on laptop computer reading financial document report in office. Accountant entrepreneur manager businesswoman doing paperwork using pc. Copy space
Abstract Financial Data Processing and Analysis Interface
Dynamic Stock Market Chart with Fluctuating Trends and Data Points
Fluctuating Stock Market Graph with Dramatic Peaks
Falling Market Trend with Empty Classroom Background
Financial Data Displayed Over City Skyline with Rising Graphs
Dynamic Graph with Vibrant Lines on Black Background
Premium
Financial advisor explaining invest stock market data consulting investor. Two busy business men analysts doing finance trading analysis pointing at exchange chart on laptop screen working in office.
Global Financial Data Analysis with World Map Visualization
Financial Data Flow against Urban Skyline Backdrop
Digital Financial Data Analysis With Declining Graph
Analyzing Financial Graphs with Colorful Chart Lines
Premium
Businesswomen use magnifier glass find stock in stock markets, uptrends, growth economics, business strategy development, and opportunities for investment, take profit from funds, Financial Analyst.
Green Line Rising on Digital Trading Board with Abstract Background
Digital Financial Data Charts and Statistics Analysis
Dynamic Global Market Trends Over World Map Visualization
Dynamic Data Visualization and Financial Growth Curves
Premium
Data analysis, business meeting or woman with graph presentation in office for revenue, profit or sale statistics. Chart, analytics or accounting mentor brainstorming economy, inflation or solution
Growth Trend with Green Line Overlay and Modern Cityscape
Dynamic Financial Data Chart Display with Graphical Analysis
Digital Stock Market Green Graph Against Dark Trading Board
Financial Market Chart on Digital Screen Showing Growing Trends
Premium
Scientist working with business data, finance, marketing report, Big Data Analytics technology, Processing Complexity information flow on virtual screen, machine learning, artificial intelligence, ML
Rising Financial Data Graph on Digital Grid Background
Tech-Focused Financial Data Visualization with Rising Graphs
Analyzing Financial Charts on Digital Screen
Graphical Stock Data Overlapped on Urban Architecture
Premium
Analyst working with Financial Data and Business Analytics Dashboard on computer to make Financial Report with KPI and Metrics. Investment, Corporate Finance, Strategy, Operations, Sales.
Financial Data Graph Over Cityscape with Digital Overlay
Colorful Line Graphs Depicting Fluctuating Financial Trends
Digital Data Analysis over Cityscape Stock Market Concept
Green Line Graph Depicting Sustainability and Environmental Icons
Premium
An analyst uses a computer and dashboard for data business analysis and Data Management System with KPI and metrics connected to the database for technology finance, operations, sales, marketing
Financial Growth Statistic Data Processing Over Urban Cityscape
Dynamic Stock Market Analysis with Digital Graph Lines
Dynamic Stock Market Graphs Indicating Financial Trends
Financial Growth Graph Amid Urban Skyline Background
Financial Data Analysis with Vibrant Lines on Blue Background
Financial Data Analysis with Digital Grid Chart
Premium
Smiling mature businessman holding smartphone sitting in office. Middle aged manager ceo using cell phone mobile apps and laptop. Digital technology applications and solutions for business development
Fluctuating Financial Graph with Red Line on Green Grid
Digital Financial Data Visualization with Graph and Metrics
Cityscape with Financial Data Overlay and Digital Graphics
Digital Finance: Modern Stock Market Analysis Display
Premium
Financial Expert Reviews Market Projections and Investment Strategies on Computer
Dynamic Stock Market Data Amid Empty Office Setting
Rising Graphs Over Cityscape Illustrating Financial Growth
Digital Graph Over Data Center Aisle Reflecting Financial Trends
Digital Financial Data Graph Showcasing Market Trends
Premium
Businesswoman working on laptop, using mobile phone at modern office, analyzing business document with financial graph, market report on digital tablet, business data analysis concept
Dynamic Digital Market Analysis with Holographic Data
Financial Graphs Displaying Business Trends on Grid Background
Dynamic Forex Trading Graphs with Increasing Numbers
Financial Data Processing with Rising Graphs
Premium
Dashboard finance management on laptop computer analyzing sales data and growth graph chart report. Business planning, strategy and development. Financial accounting. market research, data analysis
Colorful Graphs Overlay Data Center with Coding Theme
Financial Graphs Overlay Virtual Data Office Computers
Financial Growth Data Overlay on Urban Skyline
Data Analytics and Business Strategy Network Interface
Premium
Businessman, finance analyst analyzing financial report and economic growth graph chart. Business strategy. planning and solution, budget management, business success, finance investment background
Colorful Line Graphs Displaying Data Over City Skyline
Dynamic Financial Data with Overlaid Cityscape Interface
Dynamic Stock Market Graph Showing Investment Trends
Global Finance and Data Analytics in Server Environment
Premium
Auditor or accountant audit financial data and accounting record documents online on the computer to report company, taxation planning for profitable cash flow. finance analysis and account management
Financial Graphs Over Urban Cityscape Illustrating Dynamic Markets