- Home >
- Stock Photos >
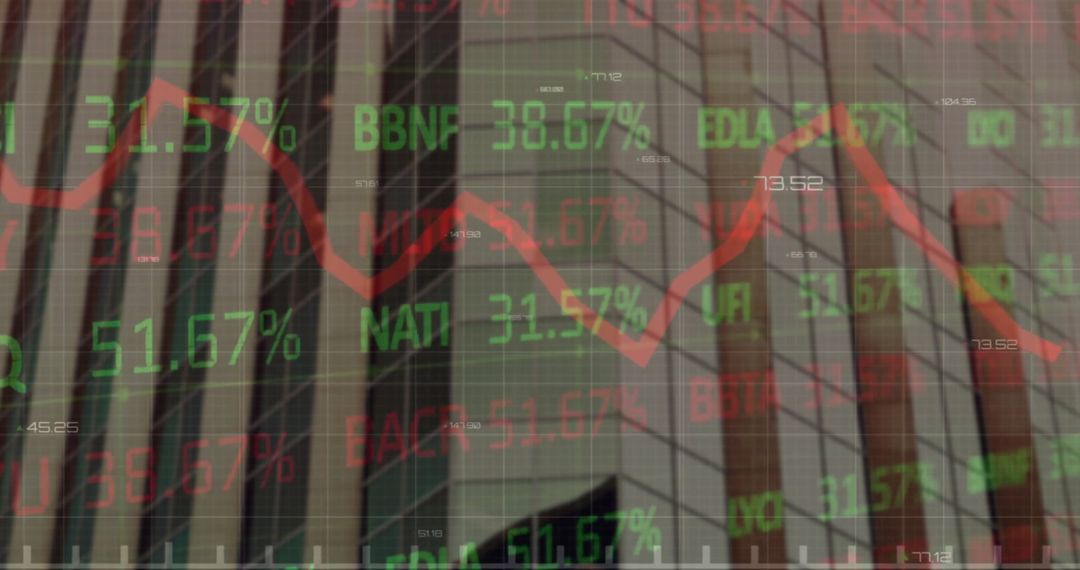
- Abstract Financial Stock Market Data Display with Green Graph Line
Abstract Financial Stock Market Data Display with Green Graph Line Image

Capturing a dynamic screen of stock market data with bright green graph lines and numerical indicators, this image represents financial trading and investment insights. The use of vivid colors and abstract vertical layout creates a sense of urgency and activity in the market. Ideal for illustrating concepts about business trends, online trading platforms, economic analysis, or financial growth forecast presentations.
Powered by 


2
downloads
downloads
Tags:
More
Credit Photo
If you would like to credit the Photo, here are some ways you can do so
Text Link
photo Link
<span class="text-link">
<span>
<a target="_blank" href=https://pikwizard.com/photo/abstract-financial-stock-market-data-display-with-green-graph-line/ed314ed9767c8aa966faeb6829efcc16/>PikWizard</a>
</span>
</span>
<span class="image-link">
<span
style="margin: 0 0 20px 0; display: inline-block; vertical-align: middle; width: 100%;"
>
<a
target="_blank"
href="https://pikwizard.com/photo/abstract-financial-stock-market-data-display-with-green-graph-line/ed314ed9767c8aa966faeb6829efcc16/"
style="text-decoration: none; font-size: 10px; margin: 0;"
>
<img src="https://pikwizard.com/pw/medium/ed314ed9767c8aa966faeb6829efcc16.jpg" style="margin: 0; width: 100%;" alt="" />
<p style="font-size: 12px; margin: 0;">PikWizard</p>
</a>
</span>
</span>
Free (free of charge)
Free for personal and commercial use.
Author: Authentic Images
Similar Free Stock Images

Premium


Premium


Premium


Premium


Premium


Premium


Premium


Premium


Premium


Premium


Premium


Premium


Premium


Premium


Premium


Premium


Premium


Premium


Premium


Premium


Premium


Premium


Premium


Premium