- Home >
- Stock Photos >
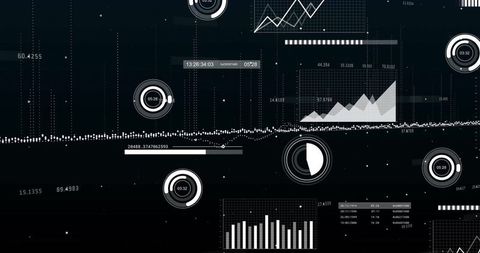
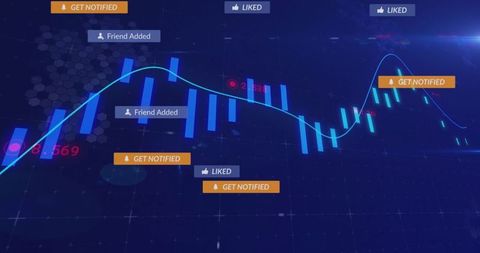
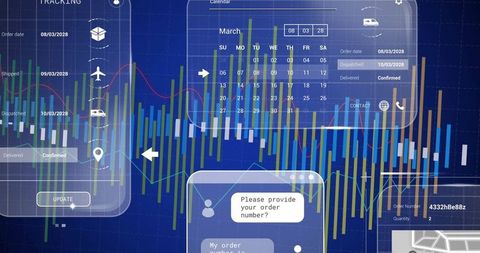
- Abstract Financial Trading Dashboard with Trend Analysis
Abstract Financial Trading Dashboard with Trend Analysis Image
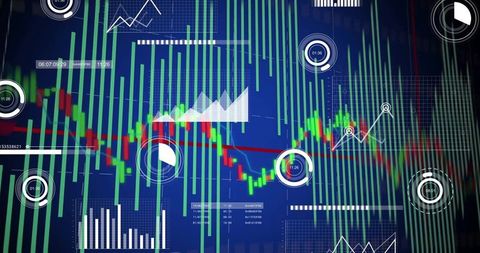
Digital display shows complex financial data including candlestick charts, trend lines, and various metrics. Used for presentations, business analysis tools, educational materials on finance, and illustrating concepts of tech-driven investments and market analytics in articles or reports.
Powered by  - Get 15% off with code: PIKWIZARD15


0
downloads
downloads
Tags:
More
Credit Photo
If you would like to credit the Photo, here are some ways you can do so
Text Link
photo Link
<span class="text-link">
<span>
<a target="_blank" href=https://pikwizard.com/photo/abstract-financial-trading-dashboard-with-trend-analysis/4c6f12e8e349f85133474fbf713f238d/>PikWizard</a>
</span>
</span>
<span class="image-link">
<span
style="margin: 0 0 20px 0; display: inline-block; vertical-align: middle; width: 100%;"
>
<a
target="_blank"
href="https://pikwizard.com/photo/abstract-financial-trading-dashboard-with-trend-analysis/4c6f12e8e349f85133474fbf713f238d/"
style="text-decoration: none; font-size: 10px; margin: 0;"
>
<img src="https://pikwizard.com/pw/medium/4c6f12e8e349f85133474fbf713f238d.jpg" style="margin: 0; width: 100%;" alt="" />
<p style="font-size: 12px; margin: 0;">PikWizard</p>
</a>
</span>
</span>
Free (free of charge)
Free for personal and commercial use.
Author: Creative Art
Similar Free Stock Images

Premium


Premium


Premium


Premium


Premium


Premium


Premium


Premium


Premium


Premium


Premium


Premium


Premium


Premium


Premium


Premium


Premium


Premium


Premium


Premium


Premium


Premium


Premium


Premium


Premium