- Home >
- Stock Photos >
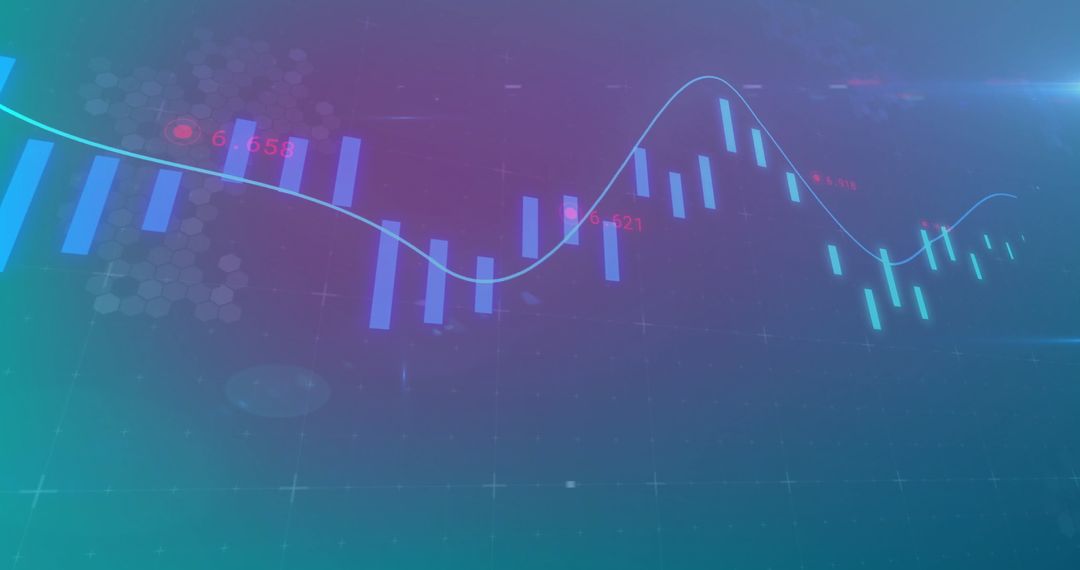
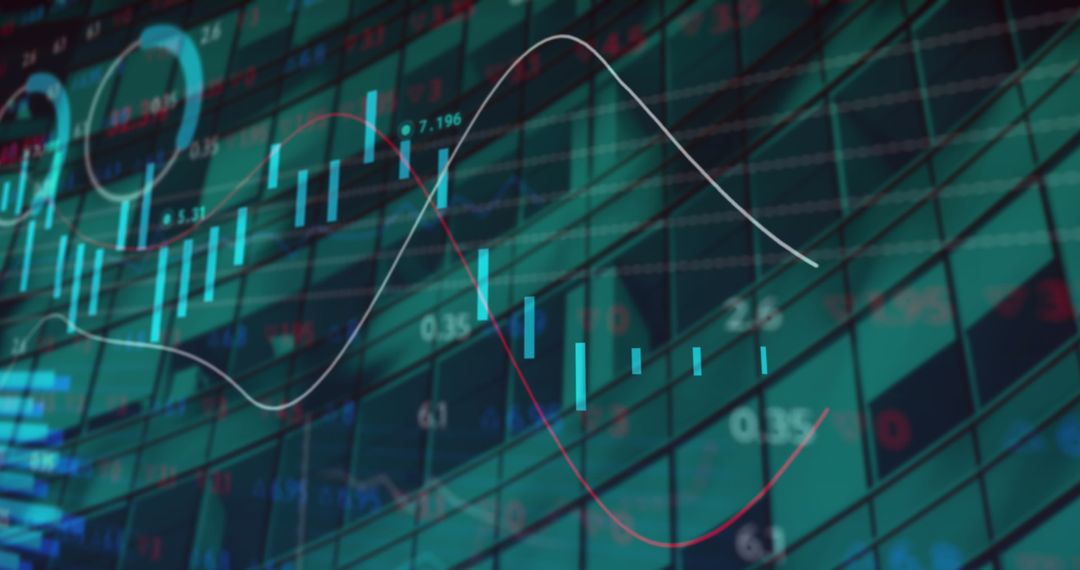
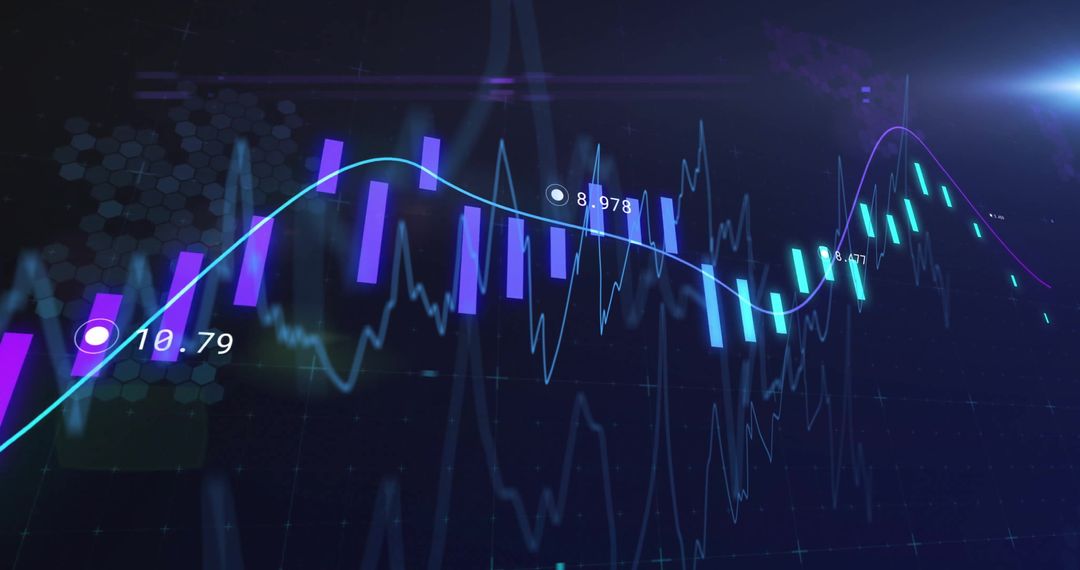
- Abstract Financial Trading Display with Dynamic Blue Wave
Abstract Financial Trading Display with Dynamic Blue Wave Image

AI Generated Image. This conceptually rich depiction of a trading display featuring red and green candlestick bars intertwined with a dynamic translucent blue wave epitomizes modern finance. Perfect for illustrating articles about stock markets, investment strategies, financial technology, or data analysis. Ideal for use by financial publications, blogs focusing on digital finance trends, and educational materials about trading technologies.
Powered by  - Get 15% off with code: PIKWIZARD15


2
downloads
downloads
Tags:
More
Credit Photo
If you would like to credit the Photo, here are some ways you can do so
Text Link
photo Link
<span class="text-link">
<span>
<a target="_blank" href=https://pikwizard.com/photo/abstract-financial-trading-display-with-dynamic-blue-wave/2fe5f4f9607a30ba6da38b61edf317be/>PikWizard</a>
</span>
</span>
<span class="image-link">
<span
style="margin: 0 0 20px 0; display: inline-block; vertical-align: middle; width: 100%;"
>
<a
target="_blank"
href="https://pikwizard.com/photo/abstract-financial-trading-display-with-dynamic-blue-wave/2fe5f4f9607a30ba6da38b61edf317be/"
style="text-decoration: none; font-size: 10px; margin: 0;"
>
<img src="https://pikwizard.com/pw/medium/2fe5f4f9607a30ba6da38b61edf317be.jpg" style="margin: 0; width: 100%;" alt="" />
<p style="font-size: 12px; margin: 0;">PikWizard</p>
</a>
</span>
</span>
Free (free of charge)
Free for personal and commercial use.
Author: AI Creator
Similar Free Stock Images

Premium


Premium


Premium


Premium


Premium


Premium


Premium


Premium


Premium


Premium


Premium


Premium


Premium


Premium


Premium


Premium


Premium


Premium


Premium


Premium


Premium


Premium


Premium


Premium