- Home >
- Stock Photos >
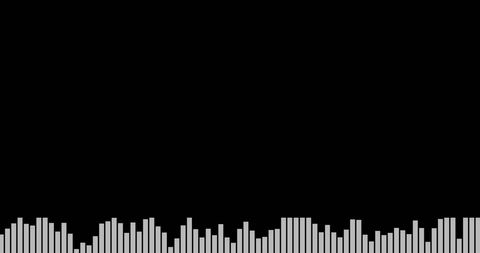
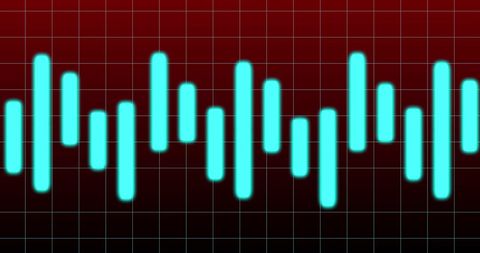
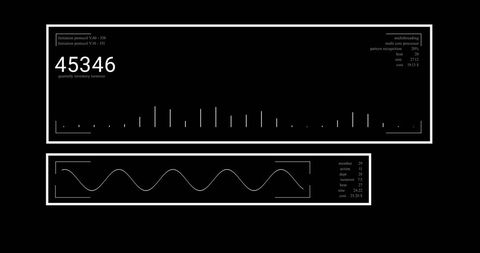
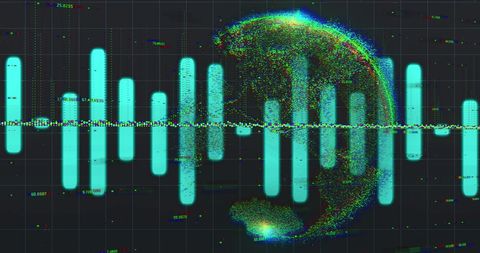
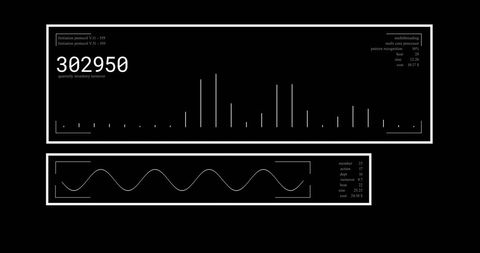
- Abstract Frequency Bars on Dark Background
Abstract Frequency Bars on Dark Background Image

This visualization features sound waves and frequency bars glowing green against a dark backdrop, typically employed to represent audio technology or music. Suitable for illustrating concepts related to digital sound, electronic music, or technology design, it can be used in websites, presentations, and print media focusing on music production, sound engineering, or technology interfaces.

downloads
Tags:
More
Credit Photo
If you would like to credit the Photo, here are some ways you can do so
Text Link
photo Link
<span class="text-link">
<span>
<a target="_blank" href=https://pikwizard.com/photo/abstract-frequency-bars-on-dark-background/65499c73fbac4c77500b7fc5bac09342/>PikWizard</a>
</span>
</span>
<span class="image-link">
<span
style="margin: 0 0 20px 0; display: inline-block; vertical-align: middle; width: 100%;"
>
<a
target="_blank"
href="https://pikwizard.com/photo/abstract-frequency-bars-on-dark-background/65499c73fbac4c77500b7fc5bac09342/"
style="text-decoration: none; font-size: 10px; margin: 0;"
>
<img src="https://pikwizard.com/pw/medium/65499c73fbac4c77500b7fc5bac09342.jpg" style="margin: 0; width: 100%;" alt="" />
<p style="font-size: 12px; margin: 0;">PikWizard</p>
</a>
</span>
</span>
Free (free of charge)
Free for personal and commercial use.
Author: Creative Art