1. Home > 
  2. Stock Photos > 
  3. Abstract Global Business Growth Digital Composite

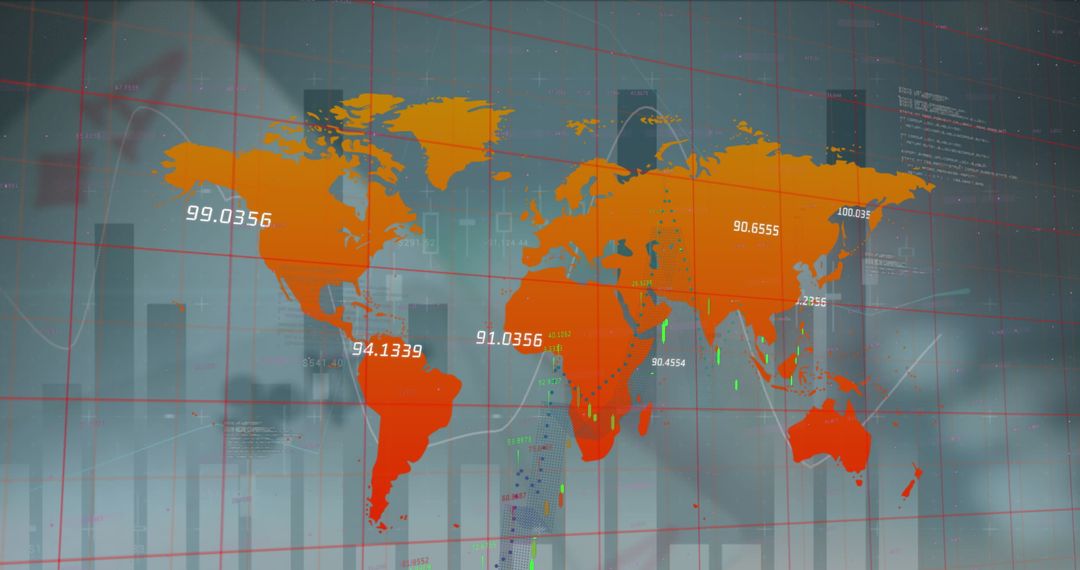
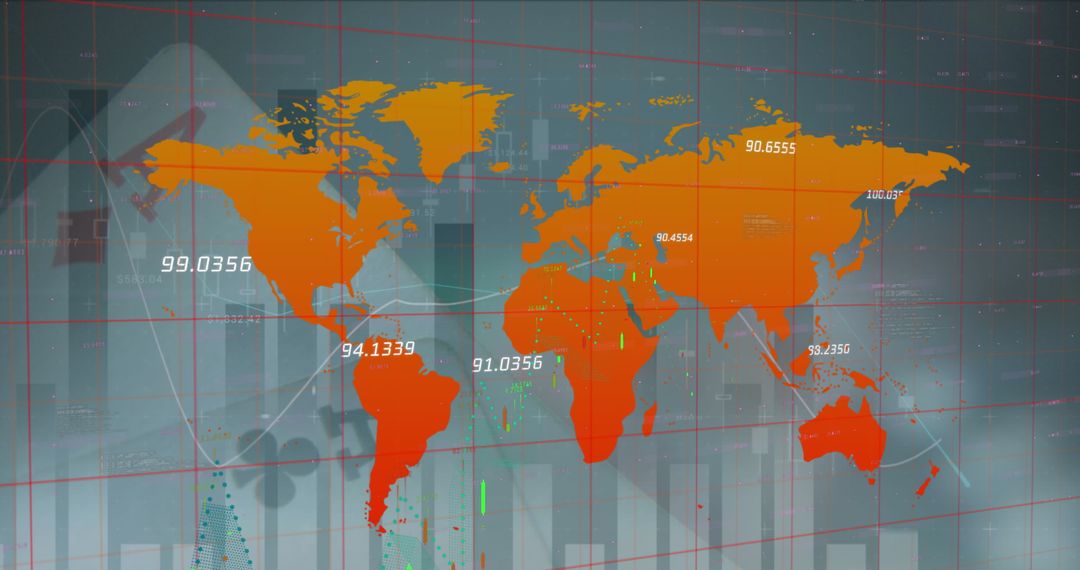
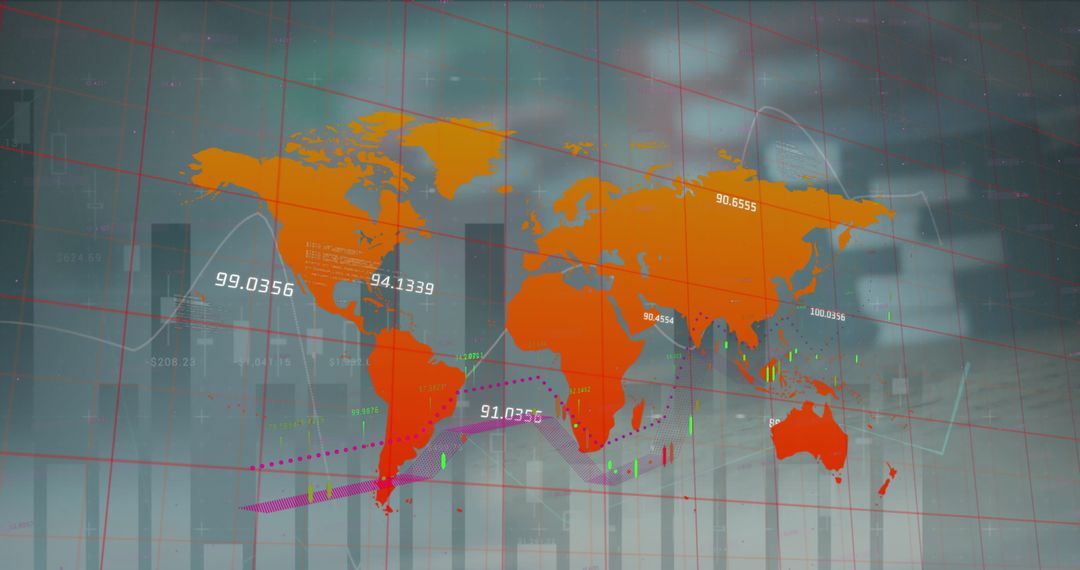
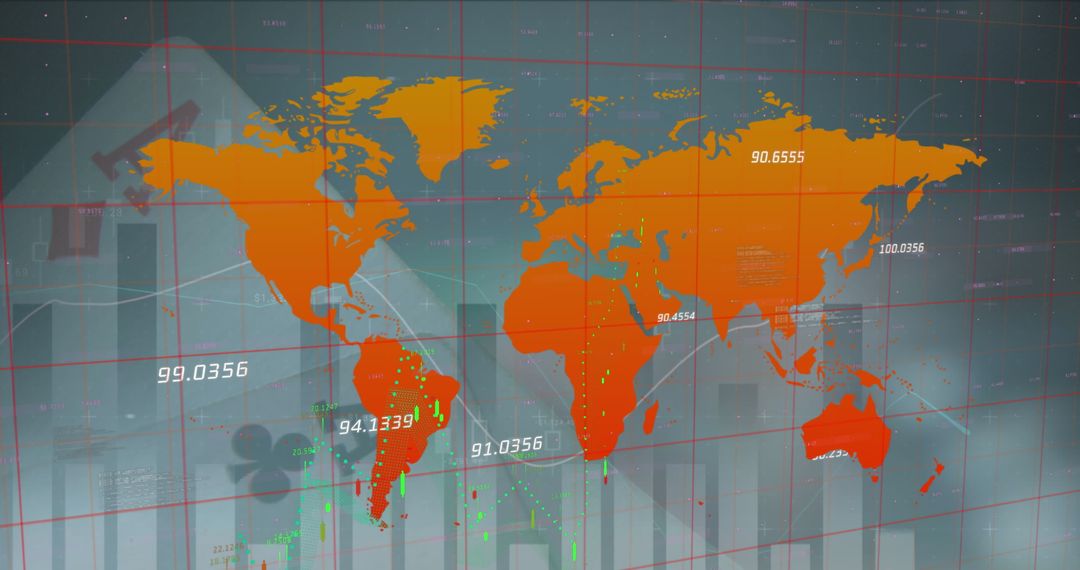
Abstract Global Business Growth Digital Composite Image

Abstract Global Business Growth Digital Composite

World map with financial graphs overlays digital concept of business growth analysis. Useful for illustrating global market trends, technology in finance, or business intelligence processes. Ideal for business presentations, financial reports, and educational materials in economic studies.

Powered by Shutterstock logo - Get 15% off with code: PIKWIZARD15
Analysis finance grow graph and market  investment. Financial  business plan,earnings,sale and strategy. Stock market chart, exchange financial growth diagram. - Powered by Shutterstock - Get 15% off with code: PIKWIZARD15Business strategy development and growing growth plan.	
Financial management strategy for business growth.Graph and chart. Investment of growth on currency rate. - Powered by Shutterstock - Get 15% off with code: PIKWIZARD15Business woman sitting front laptop computer with financial graphs and statistics on monitor. Double exposure. Wide - Powered by Shutterstock - Get 15% off with code: PIKWIZARD15hand show graph chart stock market economic. growth business concept. plan strategy company increase profit to success global. trend marketing grows technology digital. economy, financial, and invest - Powered by Shutterstock - Get 15% off with code: PIKWIZARD15Man look at the dashboard with graphs and charts. Concept of data management system, business intelligence, data statistics, marketing analysis, key performance indicators (KPI) and analytics. - Powered by Shutterstock - Get 15% off with code: PIKWIZARD15

Credit Photo

If you would like to credit the Photo, here are some ways you can do so

Free (free of charge)

Free for personal and commercial use.

Author: Awesome Content

Similar Free Stock Images

Abstract Financial Graphs with Bar Charts and Line Indicators
Premium
Stockmarket online trading chart candlestick on crypto currency platform. Stock exchange financial market price candles graph data pattern analysis concept. Computer screen closeup background
Financial Data Processing in Open Office with Digital Interface Overlay
Futuristic Data Technology in Modern Office Environment
Digital Financial Graphs and Charts Display
Team Collaborating with Overlay of Statistical Data Graphics in Office
Premium
Man look at the dashboard with graphs and charts. Concept of data management system, business intelligence, data statistics, marketing analysis, key performance indicators (KPI) and analytics.
Business Professionals Analyzing Digital Financial Graphs
Financial Analytics Overlay in Modern Office Environment
Financial Data Visualization with Business Professionals in Office
Businessman Analyzing Financial Statistics at Night
Premium
Stock market chart, exchange financial growth diagram.Analysis finance grow graph and market investment. Financial business plan,earnings,sale and strategy.
Businessman Reflected in Financial Data Ridge Graph Display
Digital Interface Showing Financial Data Over Urban Cityscape
Financial Data Visualization on Abstract Background
Businessman Overlooking Financial Graphs and Charts in Office
Premium
Young woman working at night modern office.Technical price graph and indicator, red and green candlestick chart and stock trading computer screen background. Double exposure.Wide
Digital Data Processing with Cityscape and Graphs Overlay
Data Analytics and Processing in Modern Office Environment
Dynamic Global Finance and Statistics Visualization with World Map
Global Data Analytics Overlaying World Map With Technology Icons
Premium
AI ,Business visionary points to AI letter icon on a world map, symbolizing the strategic utilization of AI in global business. Embrace innovation and navigate the future of intelligent technology
Analyzing Financial Data: Businessman Surrounded by Digital Information
Businessman Analyzing Financial Growth Metrics in Modern Office
Digital Interface with World Map and Data Processing in Server Room
Digital Interface with Financial Graphs and Data Analysis
Premium
A magnifying glass over a financial chart, illustrating market analysis and business concepts, in blue light against a dark background.
Financial Graphs Analyzing Corporate Market Trends
Global Data Processing and Cybersecurity with Digital World Map Overlay
Digital Data Processing over Server Room with Global Connections
Financial Chart Overlay in Modern Corporate Office
Financial Data Charts Overlay on Modern Office Workspace
Financial Data Analysis and Technology in Modern Business Office
Premium
Stock market or forex trading graph in futuristic concept suitable for financial investment or Economic trends business idea and all art work design. Abstract finance background
Futuristic Finance with AI-Digital Interface
Financial Data Analysis with Cityscape Overlay
Business People Overlapped with Financial Chart Visuals
Financial Graphs with Data Visualization in Office Background
Premium
Earth sphere hologram with candlesticks and growing lines. Panoramic Bangkok cityscape at night. Concept of forex and investment, online trading and global market
Financial Data with Dynamic Chart in Modern Office Setting
Stock Market Analysis and Urban Skyline Business Growth
Business Professionals Analyzing Digital Data Trends
Financial Analysis Abstract Overlay of Businessman with Graphs
Premium
graph stock market economics, chart growth business to success globally. concept of investment, plan strategy, increase profit, financial economy, and grow marketing. digital technology trend
Digital Financial Data Processing and Global Technology Interface
Businesswoman Using Headset Analyzing Financial Data in Office
Women Collaborating Overlaid with Financial Data in Modern Office
World Map Overlay in High-Tech Server Room
Premium
Businessman using futuristic user interface with virtual data analytics. Innovative dashboard with financial charts, graphs, and global network information for business intelligence.
Global Financial Data and Analysis Over City Skyline
World Map Analytics Projection with Numerical Data
Global Data Analytics Overlaid on Virtual Poker Background
World Map Displaying Financial Data with Night City Traffic
Premium
Stock market graph trading analysis investment financial, stock exchange financial or forex graph stock market graph chart business crisis crash loss and grow up gain and profits win up trend.
Technological Impact on Global Finance with Urban Overlays
Digital Graphs in Modern Office for Business Progress Concept
Abstract Financial Data Charts with Modern Office Setting
Global Financial Data with World Map and Graph Trends
Premium
2025 Trends concept. A businessman working on laptop with 2025 TRENDS globe and icons representing AI, e-commerce, finance, healthcare, online work, biotechnology, technology and green business.
Businessman in Office Analyzing Financial Data Stocks
Double Exposure of Financial Charts with Modern Office Background
Candlestick Charts Overlay on Modern Office Background
Financial Data Analysis Overlay in Modern Office Environment
Financial Data Analytics Overlaying Modern Office Background
Digital Financial Data Overlaid on Busy Cityscape
Premium
adult man hand hold smartphone and use social media network application to check new feedback or interactive with people or friend by reply chat or send emoticon for  react feeling and moment concept
Abstract Financial Data with Graphs Over Cityscape
Abstract Financial Data Concept with Business Professionals
Businessman Analyzing Global Financial Data Overlay
Business Team Analyzing Digital Data Overlay Graphic
Premium
Stock market or forex trading graph on touchscreen,  finance and investment concept. Economy trends for business, financial charts and digits.
Business Experts Analyzing Financial Graphs in Office
Caucasian Businesswoman Analyzing Financial Data Background
Urban Financial Data Overlays and Crowd Movement
Caucasian Businessman Engaging in Financial Data Analysis
Premium
Business intelligence technology and big data analytic mixed media showing concept of futuristic information report using computer software to analyze strategic investment advice for decision making .
Business Team Discussing Financial Data with Cityscape Overlay
Global Financial Data on High-Tech World Map Background
Global Data Processing and Technology Network Concept
Advanced Business Data Analytics over Urban Cityscape
Premium
Business man trader investor analyst using mobile phone app analytics for cryptocurrency financial market analysis, trading data index chart graph on smartphone and laptop screen. Over shoulder view
Global Technology Data Analysis in Gambling Context
Digital World Map with Data Analytics and Gambling Symbols Overlay
Global Circuit Board Overlay in Modern Data Center
Business Team Analyzing Financial Trends with Digital Interface
Premium
Double exposure image of coin stacks on technology financial graph background.Economy trends background for business ,financial meltdown ,Cryptocurrency digital economy.
Digital Interface Featuring Global Networking and Data Analytics
Futuristic Cityscape with Digital Data Overlay Concepts
Finance Graphs Overlay Empty Modern Office
Financial Data Analytics Overlapping Modern Cityscape
Premium
Stock market graph trading analysis investment financial In red, stock exchange financial or forex graph stock market graph chart business crisis crash loss and grow up gain and profits win up trend.
Financial Data Visualization on Digital World Map Background
Financial data overlaying modern open-plan office with candlestick charts and trend lines
Digital Financial Market Analysis Over Modern Office Background
Financial Data Charts Over Urban Skyscrapers Concept
Abstract Financial Data Overlaid on Empty Warehouse Perspective
Futuristic Financial Data Processing in Modern Office
Premium
Double exposure.Two stock traiders making analysis of digital market and investment in block chain crypto currency. Stock trade concept
Business Professionals Analyzing Digital Financial Interface
Business Professionals Analyzing Financial Data Stocks Trend
Businesswomen Discussing Data with Infographic Overlay
Abstract Financial Data and Business Office Concept
Premium
Businessman planning digital stock market analysis strategy showing positive technology chart powerful investment ideas exchange rate economy development stock growth and business success goals
Composite of Digital Financial Data Overlaid on Cityscape
Financial Data Interface Over Cityscape Vibe
Futuristic Traffic Technology and Data over Urban Cityscape
Financial Data Analysis Overlay on Cityscape Background
Premium
Big Data Technology for Business Finance Analytic Concept. Modern graphic interface shows massive information of business sale report, profit chart and stock market trends analysis on screen monitor.
Virtual Data Center with Mathematics Overlay
Digital Interface Displays Financial Analytics in Urban Office Landscape
Digital Composite of Financial Graphs in Modern Conference Room
Digital Global Finance Concept with Data and Charts
Premium
Image of financial data processing over diverse business people in office. Global finance, business, connections, computing and data processing concept digitally generated image.
Digital Composite of Urban Business and Technology Themes
Business Team Collaborating with Digital Financial Graph in Office
Businessman Analyzing Digital Financial Graphs in Urban Setting
Blockchain Data Processing in Computer Servers Concept
Premium
2025 business growth, Planning, opportunity, challenge and business strategy in new year, Marketing plan continue to increase return. Development to success and motivation in 2025.
Abstract Finance Data and Renewable Energy Integration
Multi-Layered Global Financial Data with Cityscape Background
Financial Data Processing with Digital Analytics in Office
Global Data Analysis with Digital World Map on Server Background
Premium
Digital marketing sale analysis, Business development, Finance analyst analyzing sale data, business growth graph chart and financial report, business target,  planning, strategy and solution
Technicians monitoring server racks as candlestick charts and analytics overlay data center