
- Home >
- Stock Photos >
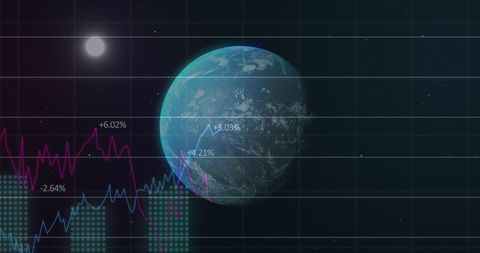
- Abstract Global Finance Chart with Data Visualization Grid
Abstract Global Finance Chart with Data Visualization Grid Image

Depiction of global financial data over an illuminated grid background, conveying themes of analytics, data processing, and technological integration. The rising line suggests growth or trend analysis. Ideal for use in financial reports, digital presentations, and articles about global economic trends or digital finance technology.
Powered by  - Get 15% off with code: PIKWIZARD15


downloads
Tags:
More
Credit Photo
If you would like to credit the Photo, here are some ways you can do so
Text Link
photo Link
<span class="text-link">
<span>
<a target="_blank" href=https://pikwizard.com/photo/abstract-global-finance-chart-with-data-visualization-grid/580a22d3c84504e8215245d19e7f92e2/>PikWizard</a>
</span>
</span>
<span class="image-link">
<span
style="margin: 0 0 20px 0; display: inline-block; vertical-align: middle; width: 100%;"
>
<a
target="_blank"
href="https://pikwizard.com/photo/abstract-global-finance-chart-with-data-visualization-grid/580a22d3c84504e8215245d19e7f92e2/"
style="text-decoration: none; font-size: 10px; margin: 0;"
>
<img src="https://pikwizard.com/pw/medium/580a22d3c84504e8215245d19e7f92e2.jpg" style="margin: 0; width: 100%;" alt="" />
<p style="font-size: 12px; margin: 0;">PikWizard</p>
</a>
</span>
</span>
Free (free of charge)
Free for personal and commercial use.
Author: People Creations
Similar Free Stock Images

Premium


Premium

Premium


Premium


Premium


Premium


Premium


Premium

Premium


Premium


Premium


Premium


Premium


Premium


Premium


Premium

Premium


Premium

Premium


Premium

Premium


Premium

Premium


Premium


Premium


Explore More Free Stock Images