1. Home > 
  2. Stock Photos > 
  3. Abstract Global Finance with Rotating Globe and Data Graphs

Abstract Global Finance with Rotating Globe and Data Graphs Image

Abstract Global Finance with Rotating Globe and Data Graphs

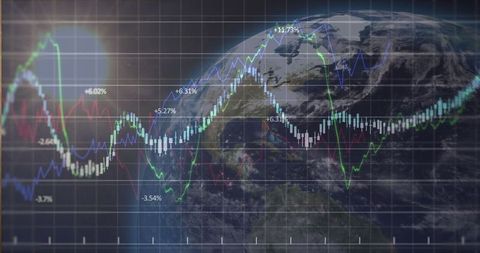
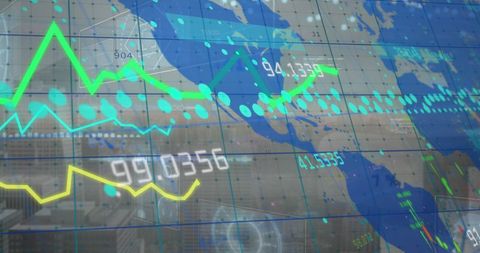
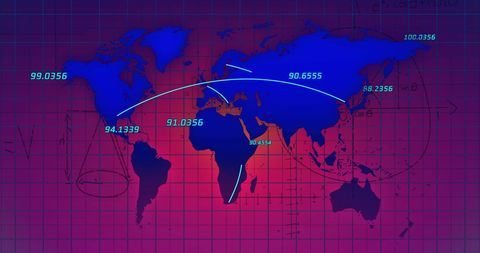
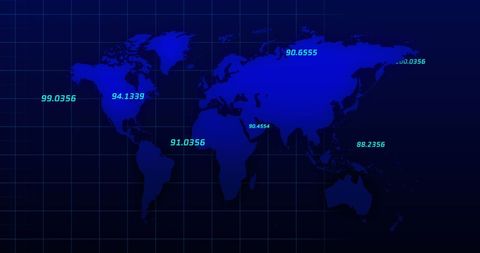
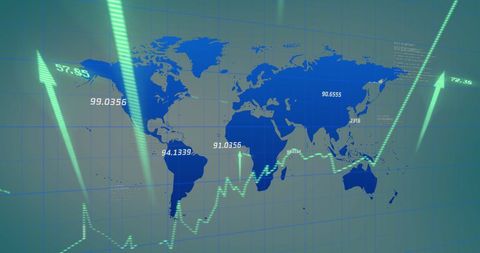
Image illustrates abstract concept of global finance with rotating earth and superimposed financial graphs. Suitable for depicting economic growth, market analysis, business projections, or technological investment services. Ideal for using in presentations, websites, and reports focused on economy, finance, or global trade.

Powered by Adobe logo
Graphs and world financial markets data. Investor pointing at the candlestick chart. - Powered by AdobeBusiness, finance and investment background. Finance analyst analyzing digital marketing financial report, sale growth with stock market graph, business planning and market research - Powered by AdobeBusinessman looks at digital trading platform with market charts, Indian flag background. Economic growth, stock exchange, investment trends finance concept. India financial market, global - Powered by AdobeA small globe sits atop stacks of gold coins with a blurry financial stock chart in the background, symbolizing global finance and economic markets. - Powered by AdobeBlurred forex background, economy finance business stock earth global market financial forex map chart digital investment graph background. - Powered by Adobe

Credit Photo

If you would like to credit the Photo, here are some ways you can do so

Free (free of charge)

Free for personal and commercial use.

Author: Creative Art

Similar Free Stock Images

Loading...
Global Financial Data Processing in Digital Interface
Premium
Stock market investment trading graph growth.Investment finance chart,stock market business and exchange financial growth graph.
Global Finance and Economy Interface with Digital Graphs
Financial Chart and Rotating Globe on Digital Grid Background
Global Financial Markets and Technology Analysis
Global Data Network Processing on Digital Interface
Premium
Growth market graph of investment abstract background
Futuristic Digital Interface with Scanning Patterns and Data Overlay
Financial Data Analysis Graph with Growing Trends
Digital Data Processing on Globe Interface Background
Global Financial Data Processing with World Map Background
Premium
Jade sharp arrow moving up a financial graph, dark background, high detail
Abstract City Traffic Analytics with Data Overlay
Futuristic Technology Concept with Global Data Visualization
Global Stock Trading Concepts with Dynamic Data Visualizations
Global Financial Analytics with Earth and Stock Market Data
Premium
Dynamic financial chart overlaying stunning cityscape at night, symbolizing growth and opportunity in the modern business world with vibrant colors
Futuristic Global Connectivity with Digital World Map
Soundwaves with Graph Overlays in Data Processing Concept
Global Financial Trends with Digital World Map and Data Charts
Global Financial Data Displayed with Digital Earth
Statistics and Data Processing with Graphs and Charts
Premium
Electric power transmission tower at sunset with overlay of financial stock market data charts
Global Stock Market Data Overlayed on World Map
Global Data Analytics with Financial Graphs Overlay
Futuristic Data Processing Over Globe Illustrating Global Connectivity
Global Data Analysis on Digital Interface World Map
Premium
stock market trend chart
Premium
Transparent or png stock market investment trading graph growth.Trade business analytics graph and financial chart.
Global Market Analytics Visualization with Financial Trends on Earth
Digital Padlock Shield in Secure Global Interface
Global Business Data Overlays on Digital Globe
Global Financial Data Analysis on Digital World Map Background
Premium

Dynamic blue and green digital stock market graph with bar charts and lines on a dark background, representing financial data analysis, investment trends, business growth, and global economy fluctuat
Global Financial Data and Analytics Overlay
Global Connectivity in Data and Financial Markets Conceptual Design
Global Financial Market Data Processing and Connectivity
Global Economic Trends with Data and Arrows on World Map
Global Data Network with Digital Graphs and Technology Overlay
Premium
stock market investment trading graph growth.Trade business analytics graph and financial chart.
Premium
US Capitol building with American flag and financial stock market charts. Economy and business concept. Investment and finance in America.
Business Cybersecurity Hologram with Globe and Charts
Abstract Financial Data Visualization with Multicolored Graphs
Stock Market Data Visuals Displaying Financial Analysis Trends
Digital Data Processing with Global Connectivity Visuals
Premium
Global financial markets and digital economy technology concept
Dynamic Digital Stock Market Graph with Fluctuating Trends
Digital Security Concept with Fingerprint and Lock Icon
Digital Fingerprint Overlayed on Financial Data Illustrating Cybersecurity
Digital Soundwaves with Data Graphs and Coding Elements
Global Financial Market Data on World Map
Digital Charts Highlighting Global Finance Data Insights
Global Financial Data Analysis and Technology Trends
Digital Financial Graphs and Business Analytics on Blue Backdrop
Premium
High-resolution image of financial graphs and charts overlaying a world map.
Global Financial Data Visualization with Digital Globe and Market Trends
Digital Data Overlay on Cityscape Reflecting Global Business Trends
Digital World Map with Data Network Connections
Global Financial Data Analysis with World Map Interface
Global Data Network with Interactive Digital World Map
Global Economy Data Visualization on Financial Dashboard
3D Earth Overlaid with Digital Data and Financial Analytics
Global Finance Concept with Stock Market Data and Rotating Earth
Global Data Points Map with Numerical Analytics Overlay
Global Financial Data and Graphs Over Digital Globe Interface
Global Financial Data Connections and Digital Interface
Global Data Processing Interface Concept with Earth
Futuristic Digital Financial Network and Economic Growth
Global Data Processing with Binary and Financial Charts
Premium
Double exposure of a global world map overlay on a financial stock market trading screen with charts and data visualization
Digital Finance Technology with Global Interconnection
Global Financial Data and Map Interface in Blue
Digital Data and Graphs Overlay on Futuristic Background
Global Financial Data Visualization on World Map Design
Premium
Abstract glowing big data forex candlestick chart on blurry city backdrop. Trade, technology, investment and analysis concept
Digital Globe with Rotating Plexus Networks on World Map
Digital Financial Graph Illustrating Stock Market Trends
Global Data Processing with Futuristic Graphics
Dynamic Financial Data and Arrows with Technology Interface
Premium
Stock market business and exchange financial growth graph. Business chart data graph diagram, business trading graph investment growth, global trend arrow up and down.
Global Financial Trends with Digital Visualization and Earth
Global Financial Network with Stock Market Analytics
Digital Data Analysis Over Cityscape with Scope Overlay
Premium
Inflation and tax concept Rising inflation rates graph. Global economy recession. interest rate, business, finance and investment background. Stack of coins money with financial graph and copy space
Global Financial Data and Technology Interface
Global Financial Data Processing with Binary Codes
Global Financial Data and Stock Market Trends Over World Map
Global Financial Data Analysis with Dynamic Graphs on World Map
Digital Data Analysis on World Map Grid with Global Connectivity
Digital Finance Graph with Data Points on Dark Background
Financial Data Graphic with Rising Trends on Digital Grid
Global Data Processing with Digital Interface on Green Background
Premium
Financial market analysis stock market data and city skyline concept
Premium
The European flag with yellow stars is blurred against the background of stock market charts,
Global Finance Technology Vision over Digital Map
Global Financial Data and Digital Interface Concept
Global Financial Data Interface with Rotating Globe Overlay
Premium
A red stock market graph with the china flag in front of it, representing global economic trends and tech investors' financial news.
Premium
Inflation ,interest rates and global economy. Financial chart ripple water impact stock market crisis global economy interest rates
Digital Interface and Global Business Network Concept
Dynamic Global Data Network Visualization in Blue Tones
Financial Data Processing with Global Business Analytics
Financial Graph Overlay on Global Digital Interface
Digital Data Integration with World Map Interface Design
Digital World Map with Global Data Network
Data Processing Visualization on Digital World Map Interface
Digital Financial Data Graph with Winter Snowflake Theme
Premium
Red stock market crash chart symbolizes financial loss and economic downturn. The concept is of finance, investment, recession, and economic crisis
Global Financial Markets with Digital Interconnected Data
Dynamic Financial Graphs on Digital Screen Displaying Market Trends
Digital Data Streams Flowing Across World Map
Digital Fingerprint with Data Overlay on Futuristic Interface
Premium
Hands holding golden wheat grains with a stock market chart overlay at sunset, symbolizing agriculture trade, food security, commodity prices, and global economic trends
Premium
Business development strategy using charts, marketing progress, investment analysis, future opportunities
Dynamic Financial Data with Global Connections and Insights
Global Financial Data Overlay with Coding Elements
Global Finance and Data Processing with Digital Globe Overlay
Global Economy Visualization with Graphs and Financial Data
Premium
Screen with stock market index charts and diagrams
Premium
Shiny coil of copper wire representing industrial growth, global economy and renewable energy with stock market graph glowing in dramatic red digital style
Dynamic Financial Data Growth Chart Display
Dynamic Stock Market Chart with Shoe Icons Overlay
Global Financial Trading with Data Analytics Display
Financial Charts with Blue and Red Lines and Digital Percent Indicators
Global market dashboard displaying candlestick charts, trend lines, percent labels