
- Home >
- Stock Photos >
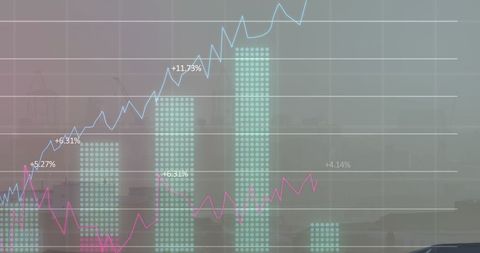
- Abstract Global Network with Dynamic Graphs
Abstract Global Network with Dynamic Graphs Image

This visualization depicts a globe intertwined with a digital network and dynamic graphs, symbolizing international connectivity and data integration. Suitable for use in technology, data analysis, and business networking contexts, it can enhance content related to global digital solutions, technological advancements, or marketing strategies in a visually compelling way.
Powered by 


downloads
Tags:
More
Credit Photo
If you would like to credit the Photo, here are some ways you can do so
Text Link
photo Link
<span class="text-link">
<span>
<a target="_blank" href=https://pikwizard.com/photo/abstract-global-network-with-dynamic-graphs/c1c0d3013b4d365a77a6a746571f49ad/>PikWizard</a>
</span>
</span>
<span class="image-link">
<span
style="margin: 0 0 20px 0; display: inline-block; vertical-align: middle; width: 100%;"
>
<a
target="_blank"
href="https://pikwizard.com/photo/abstract-global-network-with-dynamic-graphs/c1c0d3013b4d365a77a6a746571f49ad/"
style="text-decoration: none; font-size: 10px; margin: 0;"
>
<img src="https://pikwizard.com/pw/medium/c1c0d3013b4d365a77a6a746571f49ad.jpg" style="margin: 0; width: 100%;" alt="" />
<p style="font-size: 12px; margin: 0;">PikWizard</p>
</a>
</span>
</span>
Free (free of charge)
Free for personal and commercial use.
Author: Creative Art
Similar Free Stock Images

Premium


Premium

Premium


Premium


Premium


Premium


Premium


Premium

Premium

Premium

Premium


Premium


Premium


Premium


Premium


Premium


Premium


Premium


Premium

Premium


Premium

Premium


Premium


Premium


Premium

Explore More Free Stock Images