
- Home >
- Stock Photos >
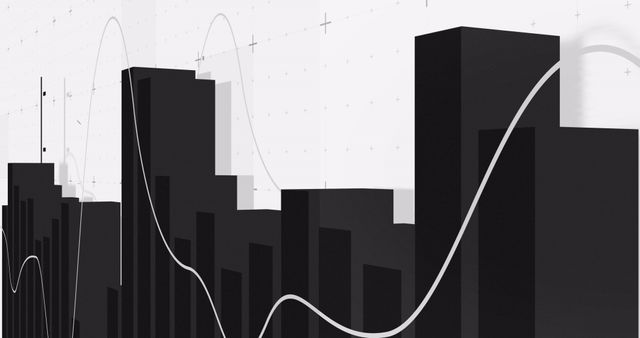
- Abstract Graph with Bar Chart Elements and Interconnected Lines
Abstract Graph with Bar Chart Elements and Interconnected Lines Image

This abstract illustration showcases a combination of bar chart elements with interconnected lines representing data analysis in finance. The design, on a clean white background, implies precision in business and market trends, making it ideal for use in presentations or promotional materials related to data science, financial services, or stock market analysis. Could work well as a background for reports or educational content exploring statistical insights.
Powered by 


downloads
Tags:
More
Credit Photo
If you would like to credit the Photo, here are some ways you can do so
Text Link
photo Link
<span class="text-link">
<span>
<a target="_blank" href=https://pikwizard.com/photo/abstract-graph-with-bar-chart-elements-and-interconnected-lines/60c74f1147a38e6fb7013eeb0e9cf4d7/>PikWizard</a>
</span>
</span>
<span class="image-link">
<span
style="margin: 0 0 20px 0; display: inline-block; vertical-align: middle; width: 100%;"
>
<a
target="_blank"
href="https://pikwizard.com/photo/abstract-graph-with-bar-chart-elements-and-interconnected-lines/60c74f1147a38e6fb7013eeb0e9cf4d7/"
style="text-decoration: none; font-size: 10px; margin: 0;"
>
<img src="https://pikwizard.com/pw/medium/60c74f1147a38e6fb7013eeb0e9cf4d7.jpg" style="margin: 0; width: 100%;" alt="" />
<p style="font-size: 12px; margin: 0;">PikWizard</p>
</a>
</span>
</span>
Free (free of charge)
Free for personal and commercial use.
Author: People Creations
Similar Free Stock Images

Premium


Premium


Premium


Premium


Premium


Premium


Premium


Premium


Premium


Premium

Premium


Premium


Premium


Premium


Premium


Premium


Premium


Premium


Premium


Premium


Premium


Premium


Premium

Premium


Premium

Explore More Free Stock Images