1. Home > 
  2. Stock Photos > 
  3. Abstract Graphical Data Analysis with Virus Cells on Purple

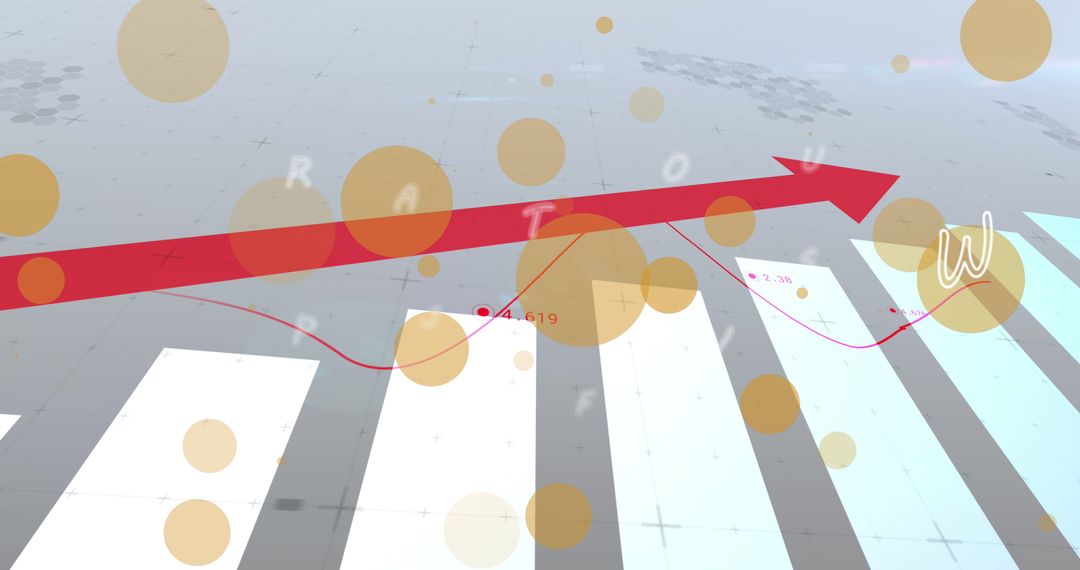
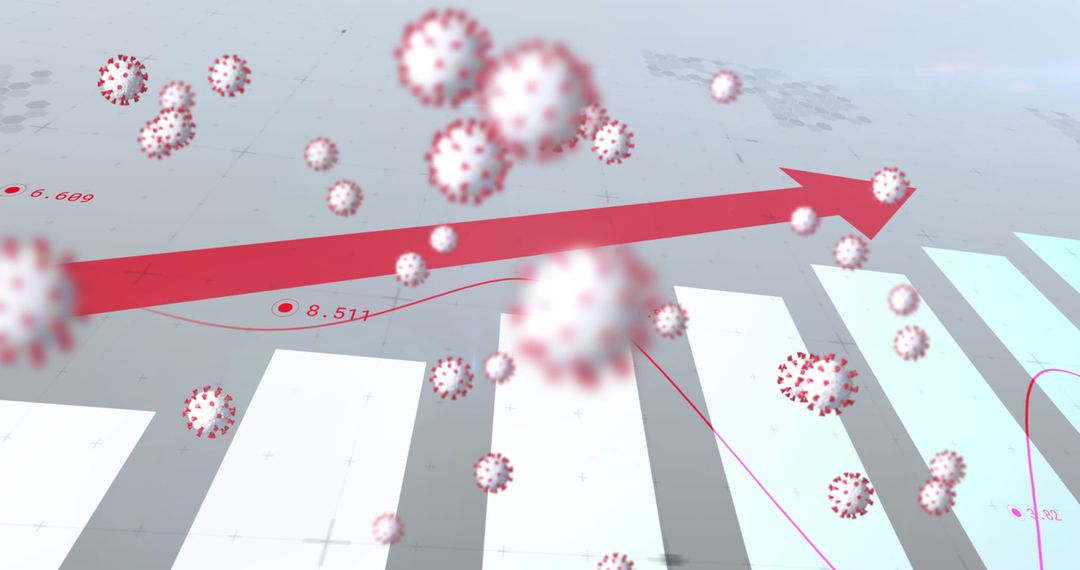
Abstract Graphical Data Analysis with Virus Cells on Purple Image

Abstract Graphical Data Analysis with Virus Cells on Purple

This digital artwork merges data analysis and virus cells depicted over a gradient purple background, illustrating the connection between global business trends and healthcare issues. Suitable for presentations relating to financial impacts of health crises, technology-driven analysis seminars, or articles discussing intersections of economy and health.

Powered by Adobe logo
Hacker drawing glowing stock chart and investment data - Powered by AdobeCoronavirus cell illustration with financial graph lines in the background. - Powered by AdobeRed virus model in focus against blue background with stock market data and bar graph illustrating economic impact of health crises - Powered by AdobeAbstract financial chart with virus spheres - Powered by Adobe3D rendering of virus cells with financial graphs illustrating economic impact - Powered by Adobe

Credit Photo

If you would like to credit the Photo, here are some ways you can do so

Free (free of charge)

Free for personal and commercial use.

Author: People Creations

Similar Free Stock Images

Analyzing COVID-19 Data with Graphical Visualizations
Premium
Business growth analysis after covid-19, business concept, after covid19 period
Covid-19 Pandemic Data Analysis with Rising Graphs
Red Rising Bar Graph with Coronavirus Illustrations
Covid-19 Data Analytics with Virus Cells and Graphs
Bitcoin Value Decline in Financial Market Analysis
Premium
Economic crisis, Businessman using mobile smartphone analyzing sales data and economic graph chart that is falling, stock market crash caused.
Digital Interface with Graphs and Virus Over Server Room
Business Growth and Financial Data Concepts
Digital Business Data Graph with Rising Arrow Overlay
COVID-19 Impact on Economic Decline with Data Chart
Premium
Global virus impact on markets
Fluctuating Financial Graph with Coronavirus Over Russian Flag Symbolism
Digital Financial Analysis with Dynamic Graph
Indian Flag Overlaid with COVID-19 Statistics and Graphs
COVID-19 Impact on India's Healthcare with Data Visualization
Premium
Coronavirus Impact on Global Market Fluctuations
Rising Financial Graph and US Dollar Collage
Graph Visuals Overlayed on Woman Meditating Reflects Global Challenges
Social Distancing Concept with Graphs and Statistics
3D Rendered Red Bar Graph with Data Visual Elements
Premium
Virus, financial data overlay
Rising Business Graph and Data Analytics in Modern Office
Digital Globalization and Technology Concept with Abstract Graphs
Digital Representation of Statistical Data Analysis in Blue Hues
Global Data Visualization and Analytics Concept
Premium
Business growth analysis after covid-19, business concept, after covid19 period
City Skyline with Financial Data Overlay Illustrating Market Trends
Rising Statistics and Cloud Data on Futuristic Purple Background
Abstract Digital Viral Art with DNA Strands
3D Red Bar Chart with Viral Icons on Digital Dashboard
Coronavirus Data Analytics and Visualization Concept Design
COVID-19 Cells with Data Visualizations on Digital Screen
Premium
Virus over financial charts
Digital Visualization of COVID-19 Graphs and Statistics
Downward Financial Trend with Data Analysis Elements
Dynamic Financial Growth with Digital Analytics Data
Digital Graph Analytics in Server Room with Virus Overlay
Premium
Graphs representing the stock market crash caused by coronavirus, and COVID-19.
Financial Data with Cloud Icons and Downward Trend
Financial Decline Graphic with Ukrainian Flag Overlay
Virus Cells Overlaying Data Charts Indicating Growth Trend
Financial Data Chart with Viral Impact Illustration
Premium
Dramatic Stock Market Crash with Coronavirus Molecules on Black Background
Indian Flag with COVID-19 Statistics and Virus Cells Overlay
India Flag Blended with COVID-19 Statistics Illustrating Crisis
Indian Flag with COVID-19 Statistics and Graph Elements
Growing Bar Chart with Data Analytics on Cloud Background
Premium
A magnifying glass
Coronavirus Pandemic Visualization with Data Graphs and Virus Cells
Digital Data Interface on Covid-19 Pandemic Trends
Futuristic Infographic Display with Glowing Pink Bar Graph
COVID-19 Data Visualization Overlay on City Skyline
Premium
Futuristic hologram of stacked gold coins glowing above a sleek and minimalistic office desk.
Digital Icons and Statistical Data Processing on Blue Background
Abstract Data Processing with Digital Graph Elements
Digital Interface Showcasing Business Decline with Moving Graphs
Rising Bar Chart in Digital Matrix Background Art
Premium
Red Pandemic Global Economic Crisis with Virus Impact, and Market Crash.
COVID-19 Statistical Data Visualization Against Cityscape Background
Abstract Genetic Helix with Floating Virus Particles
Dynamic Analytics Displaying Rising Business Performance Graphs
Covid-19 Data Analysis with Graphs and Statistics Concept Art
Coronavirus Data Analysis with Red Charts on Blue Background
Rising Graph and COVID-19 Cells on Digital Background
Premium
Coronavirus Impact on Stock Market
Business Growth Analytics with COVID-19 Impact Illustration
Modern Financial Analytics with Green Data Visualization
Digital Interface Overlay with Coronavirus on Server Background
Digital Interface Displaying Virus Graphs in Server Room
Premium
Economy and disease as an economic pandemic fear and coronavirus fears or virus Outbreak and Stock market selling as a sick financial health business recession concept with 3D illustration elements..
Increasing Bar Chart with Arrow on Green Grid Background
Digital Financial Data and Statistics Over Cityscape Background
Financial Trends and Analytics Over Russian Flag Background
Rising Graph and Virus Cells Conceptual Background
Premium
Economic crisis caused by Covid-19. Coronavirus brings financial loss, bankruptcy and recession. 3d rendering.
COVID-19 Statistics Against Indian Flag with Pandemic Graphics
India Flag Overlaid with Covid-19 Statistics and Charts
Data Analysis and Security in Digital Business Environment
Digital Financial Data with Graphs and Charts
Premium
Earth, virus, stock charts, global crisis
Financial Graph Overlay with Ukrainian Flag Colors Depicting Economic Trends
Digital Data Graph with Futuristic Interface Elements
Data Processing with Digital Growth Concepts
Futuristic Data Security and Technology Network Concept
Premium
Transparent sphere with rising graph, red & blue viruses
Global Finance and Data Visualization with Map and Bar Graphs
Data Processing and Digital Analytics Over Modern Server Room
Abstract Financial Graph and Chart Projection Illustration
Upward Financial Growth Represented Through Bar Graph in Cloudy Sky
Premium
Coronavirus Impact on Financial Markets
3D Rising Bar Chart with Virus Particles in Futuristic Network
3D Bar Chart with Virus Icons and Line Graph in High Tech Interface
Global COVID-19 Data Visualization with Red Bar Graph
COVID-19 Data Analysis with Graphs and Viral Corona Cells
Coronavirus Data Analysis with Red Graphs and Charts
COVID-19 Data and Statistics Visualization with Red Bars
Premium
Global map with economic indicators represented by colorful markers and graphs
Abstract Digital Financial Data with Bar Graphs on Green Background
Digital Interface Data with Virus Influence Overlaid on Server Room
Digital Interface with Earth Globes and Data Visualization
Futuristic Global Digital Interface Concept with Data Processing
Premium
Dramatic Decline in Travel Industry Depicted with Falling Bar Graph and Virus Models Illustrating the Impact of Global Events on Tourism and Economic Downturn
Rising Financial Chart with Virus Cells on Green Background
Rising Bar Graph with Red Arrows on Digital Background
Digital Business Interface with Global Data Processing Elements
India COVID-19 Statistics with Patriotic Theme
Premium
This image visualizes the economic impact of the Covid-19 pandemic with virus particles and an economic graph
Bar Graph Display against Cloudy Sky Background
Dynamic Data Representation with Digital Rain Effect Visualization
Abstract Eye and Shapes on Red and White Stripes
Global Pandemic Impact with Graphs and Spinning Earth
Premium
Hacker using glowing business data
COVID-19 Pandemic Impact with Interconnected Data Visuals
Dynamic Business Growth Concept with Red Bar Graph Overlay
Rising Bar Graph with Globe and Code Background Vision
Cybersecurity and Data Protection Concept with Rising Graph
Premium
3D rendering of virus cells with financial graphs showing decline and uncertainty
Rising Bar Graph with User Connections for Business Growth Concept
Growing Bar Graph in Abstract Digital Space
Floating DNA Helix With Coronavirus Representation
Global Online Security and Data Processing Visualization
Premium
Empty factory floor with faded recession graph overlays and financial decline
Digital Bar Chart Showing Growth with Viral Elements