
- Home >
- Stock Photos >
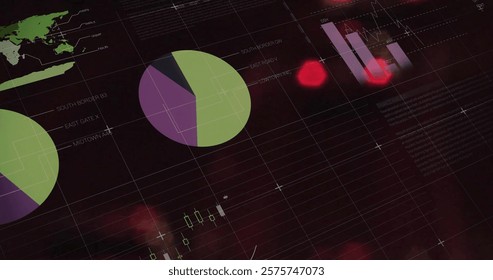
- Abstract Graphs Overlapping Financial Data Analysis
Abstract Graphs Overlapping Financial Data Analysis Image

Graphic showcasing an abstract representation of business and stock market concepts including financial data analytics, with a red fluctuating graph intersecting a pie chart overlay. Ideal for use in presentations, business reports, financial market insights, or articles discussing global finance trends.
Powered by  - Get 15% off with code: PIKWIZARD15


downloads
Tags:
More
Credit Photo
If you would like to credit the Photo, here are some ways you can do so
Text Link
photo Link
<span class="text-link">
<span>
<a target="_blank" href=https://pikwizard.com/photo/abstract-graphs-overlapping-financial-data-analysis/da186b3eb5c82ecc2bd604580965ca4e/>PikWizard</a>
</span>
</span>
<span class="image-link">
<span
style="margin: 0 0 20px 0; display: inline-block; vertical-align: middle; width: 100%;"
>
<a
target="_blank"
href="https://pikwizard.com/photo/abstract-graphs-overlapping-financial-data-analysis/da186b3eb5c82ecc2bd604580965ca4e/"
style="text-decoration: none; font-size: 10px; margin: 0;"
>
<img src="https://pikwizard.com/pw/medium/da186b3eb5c82ecc2bd604580965ca4e.jpg" style="margin: 0; width: 100%;" alt="" />
<p style="font-size: 12px; margin: 0;">PikWizard</p>
</a>
</span>
</span>
Free (free of charge)
Free for personal and commercial use.
Author: Creative Art
Similar Free Stock Images

Premium


Premium


Premium


Premium


Premium


Premium


Premium


Premium

Premium


Premium


Premium


Premium


Premium


Premium


Premium

Premium

Premium


Premium


Premium

Premium


Premium


Premium


Premium

Premium


Premium

Explore More Free Stock Images