
- Home >
- Stock Photos >
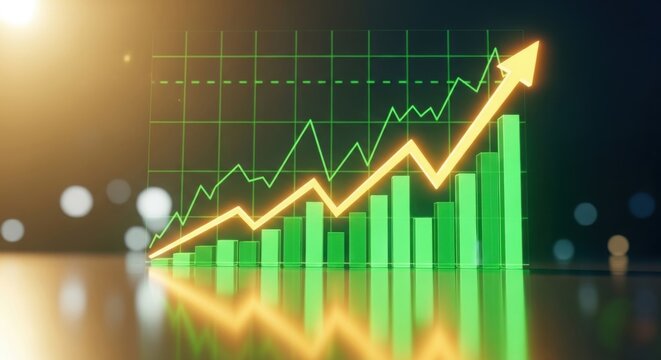
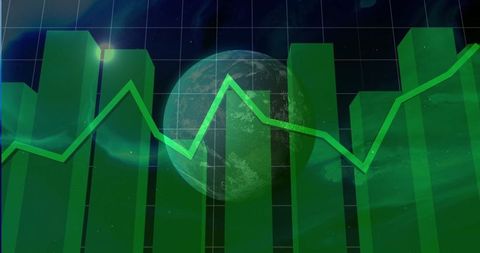
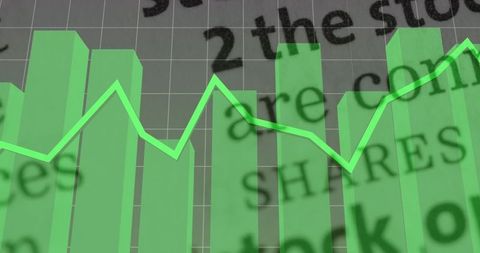
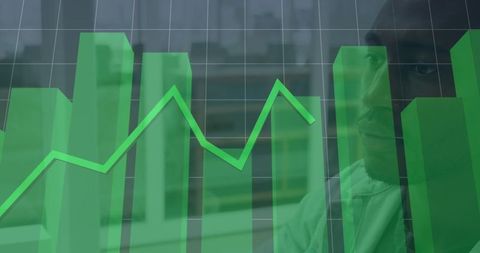
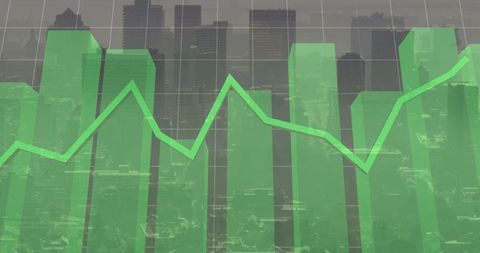
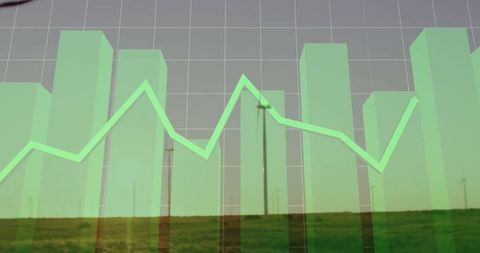
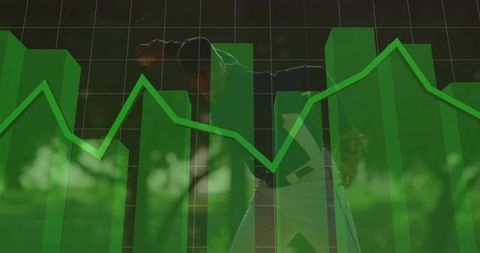
- Abstract Green Financial Growth Bar Chart
Abstract Green Financial Growth Bar Chart Image

Bar chart with green bars and line shows dynamic growth in financial values over a dark background, highlighting global economic trends through digital technology. Useful for illustrating market analysis, economic reports, investment insights, and business planning content.
Powered by 


downloads
Tags:
More
Credit Photo
If you would like to credit the Photo, here are some ways you can do so
Text Link
photo Link
<span class="text-link">
<span>
<a target="_blank" href=https://pikwizard.com/photo/abstract-green-financial-growth-bar-chart/ab46c6f81e7c29e0f1e53275472cef2b/>PikWizard</a>
</span>
</span>
<span class="image-link">
<span
style="margin: 0 0 20px 0; display: inline-block; vertical-align: middle; width: 100%;"
>
<a
target="_blank"
href="https://pikwizard.com/photo/abstract-green-financial-growth-bar-chart/ab46c6f81e7c29e0f1e53275472cef2b/"
style="text-decoration: none; font-size: 10px; margin: 0;"
>
<img src="https://pikwizard.com/pw/medium/ab46c6f81e7c29e0f1e53275472cef2b.jpg" style="margin: 0; width: 100%;" alt="" />
<p style="font-size: 12px; margin: 0;">PikWizard</p>
</a>
</span>
</span>
Free (free of charge)
Free for personal and commercial use.
Author: People Creations
Similar Free Stock Images
Loading...

Premium


Premium


Premium


Premium


Premium


Premium


Premium

Premium

Premium


Premium


Premium


Premium


Premium
Premium


Premium

Premium


Premium

Premium


Premium

Premium


Premium

Premium


Premium


Premium


Premium

Explore More Free Stock Images