- Home >
- Stock Photos >
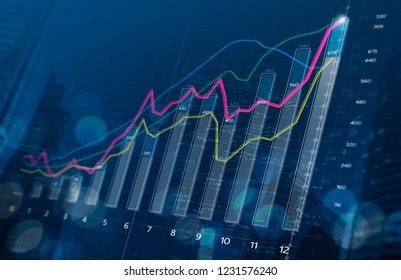
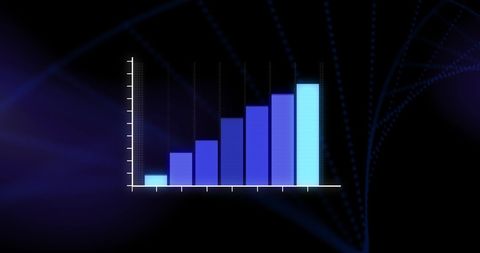
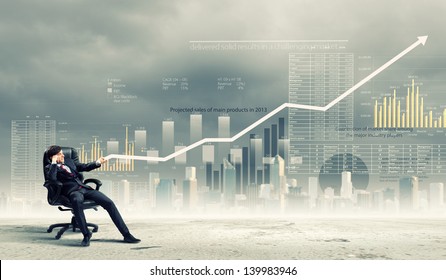
- Abstract Growing Bar Chart Against Glass Building Background
Abstract Growing Bar Chart Against Glass Building Background Image
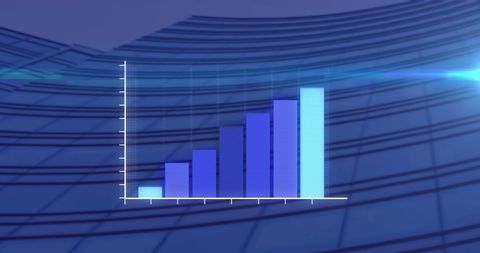
Reflecting themes of financial growth and data analysis, this design features a progressing bar chart set against a modern glass building exterior. Ideal for illustrating financial analyses, market research reports, business presentations, or articles about corporate growth and economic trends.
Powered by  - Get 15% off with code: PIKWIZARD15


downloads
Tags:
More
Credit Photo
If you would like to credit the Photo, here are some ways you can do so
Text Link
photo Link
<span class="text-link">
<span>
<a target="_blank" href=https://pikwizard.com/photo/abstract-growing-bar-chart-against-glass-building-background/5cc5083cb3203399264f4ad5bee93eb9/>PikWizard</a>
</span>
</span>
<span class="image-link">
<span
style="margin: 0 0 20px 0; display: inline-block; vertical-align: middle; width: 100%;"
>
<a
target="_blank"
href="https://pikwizard.com/photo/abstract-growing-bar-chart-against-glass-building-background/5cc5083cb3203399264f4ad5bee93eb9/"
style="text-decoration: none; font-size: 10px; margin: 0;"
>
<img src="https://pikwizard.com/pw/medium/5cc5083cb3203399264f4ad5bee93eb9.jpg" style="margin: 0; width: 100%;" alt="" />
<p style="font-size: 12px; margin: 0;">PikWizard</p>
</a>
</span>
</span>
Free (free of charge)
Free for personal and commercial use.
Author: Authentic Images
Similar Free Stock Images
Loading...

Premium


Premium

Premium


Premium

Premium


Premium


Premium


Premium

Premium
Premium

Premium


Premium


Premium


Premium


Premium


Premium

Premium

Premium


Premium

Premium


Premium


Premium


Premium


Premium
Premium