1. Home > 
  2. Stock Photos > 
  3. Abstract Infographic Interface with Mathematical Equations Overlay

Abstract Infographic Interface with Mathematical Equations Overlay Image

Abstract Infographic Interface with Mathematical Equations Overlay

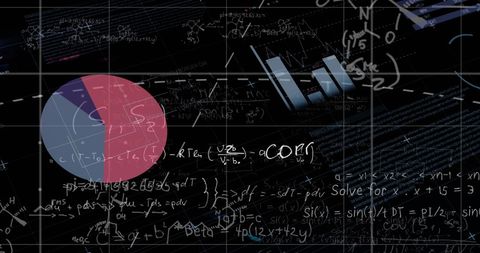
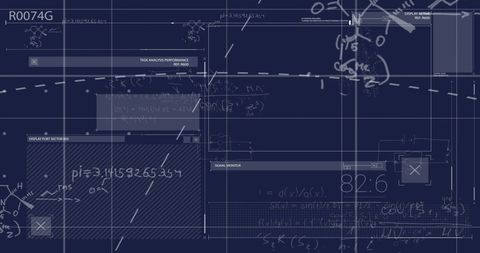
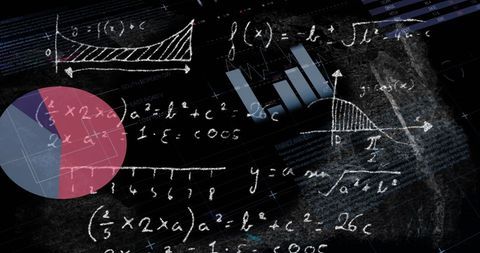
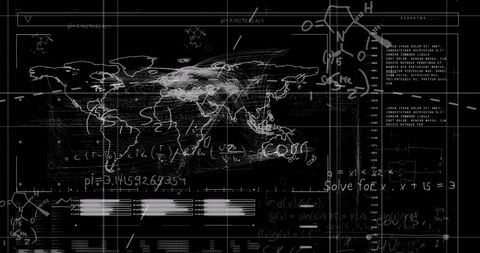
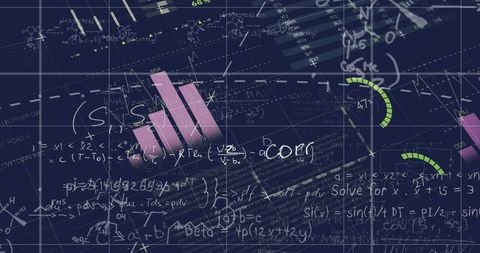
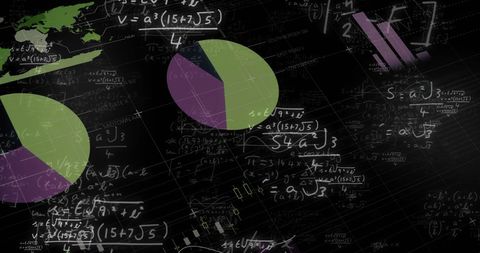
Illustration merging digital infographic elements with complex mathematical equations on a dark background symbolizing analysis in business technology contexts. Useful for publications focused on data science, finance, analytical strategy, or mathematics-related educational content.

Powered by Adobe logo
Chemistry-Themed Background with Molecules, Equations, and Lab Equipment – Scientific Design for Presentations
 - Powered by AdobePi day concept with mathematical equations and numbers on a school themed surface - Powered by AdobeDigital Innovation with Gears, Arrows, and Network Connections - Powered by AdobeScience concept - Powered by AdobeBlackboard Background Filled with Mathematical Equations and Geometric Symbols Conveying Science and Technology - Powered by Adobe

Credit Photo

If you would like to credit the Photo, here are some ways you can do so

Free (free of charge)

Free for personal and commercial use.

Author: Authentic Images

Similar Free Stock Images

Complex Mathematical Equations on Black Background
Premium
Displaying purple graphic showing receding 3D grid in virtual space, with formulas and bar chart
Confetti Falling Over Digital Stock Market Data Visualization
Global Finance with Digital Data and Interfaces
Global Financial Data Analytics and Economic Graphs
Abstract Digital Graphs and Financial Data Visualization Interface
Premium
Mathematical Symbols for Greater Than and Less Than Concept in Black and White on Light Background
High-Tech Data Analysis Interface with Graphs and Viewfinder
Global Financial Data Processing Digital Interface Concept
Abstract Financial Report Data with Graphs and World Map
Global Data Processing and Financial Analytics Visual Interface
Premium
Child wearing VR headset, interacting with geometric shapes, equations, and 3D graphs, on a white background.
Futuristic Financial Analytics and Data with Digital Interfaces
Financial Data Processing with Digital Analytics Overlay
Data Visualization Display over Modern City
Financial Data Visualization with Graphs and Global Map
Premium
An open book on wooden desk surrounded by floating mathematical formulas, with laptop in background. Scene represents education, science, and academic study in modern environment.
Mathematical Formulas Merging With City Night Skyline
Digital Data Visualization of Global Statistics and Trends
Digital Graphs and Equations on Black Background for Business and Education
Digital Data and Financial Charts on Dark Interface
Premium
Double exposure of abstract virtual chemistry hologram on modern corporate office background, research and development concept
Dynamic Data Analytics with Graphs and Charts
Abstract Digital Dashboard with Data Visualizations
Digitally Enhanced Financial Data Processing Background
Financial Data with Pie and Bar Graphs on Dark Digital Background
Premium
Abstract scientific formula hologram on a modern furnished office background. Multiexposure
Global Finance and Data Analysis Concept with Graphs
Digital Global Finance Graphics Over World Map
Cybersecurity Dashboard with Real-Time Analytics and Geometric Charts
Futuristic Analytical Dashboard with Data Visualization
Technology Concept with Seamless Integration of Digital Graphs and Transmission Towers
Futuristic Technology Display with Mathematical Solutions Overlay
Premium
A minimalist graphic template featuring mathematical equations, ideal for educational displays or presentations.
Complex Data Visualization with Global Mapping
Complex Financial Analytics and Data Visualization in Digital Space
Futuristic Digital Screen with Global Financial Data Visualization
Global Business Indicators and Data Analytics
Premium
Abstract White Equals Sign on Black
Stock Market Data Overlay Pi Symbol Background
Futuristic Financial Data and Programming Interface
Abstract Data Processing Interface with Cityscape
Digital Interface Displaying Global Finance Data Charts
Premium
Abstract Numerical and Letter Formation with Geometric Shapes
Digital Financial Data Analytics with Pie Charts and Graphs
Data Analysis and Business Statistics on Digital Interface
Global Financial Charts and Digital Data Display
Financial Data and Analytics Visualization in Digital Interface
Premium
Addition equation with foam colorful numbers on pink background.
Statistical Data Analysis with Mathematical Equations and Charts
Data Processing Overlay on Digital Charts
Financial Data Charts & Analysis on Dark Screen
Global Data Analytics and Financial Charts on Digital Display
Premium
Chemistry-Themed Background with Molecules, Equations, and Lab Equipment – Scientific Design for Presentations
Futuristic Digital Interface with Graphs and Charts in Blue Tones
Digital Interface with Global Map and Data Patterns
Futuristic Data Visualization with Mathematical Equations and Graphs
Digital Data Overlay Highlighting Global Finance and Analytics
Premium
Attractive thoughtful young european businessman with glowing digital math formulas hologram on blurry background. Ai and statistics, education concept.
Abstract Global Technology Background with Mathematical Equations
Dynamic Financial Trading Dashboard with Neon Lines and Candlestick Charts
Futuristic Data Analysis Interface with Holographic Displays
Digital Interface with Mathematical Equations and Data
Numerical Equations Radiating from Blackboard
Futuristic Financial Data and Digital Cityscape Visualization
Premium
Double exposure of scientific formula hologram on empty modern office background, research and development concept
Comprehensive Financial Data Analytics Interface with Global Indicators
Futuristic Interface with Data Highlights and Analytics
Global Financial Data Visualized on Digital Network Interface
Digital Financial Data Analysis with Stock Market Insights
Premium
Colorful science background
Dynamic Statistical Data Processing Interface
Financial Data Interfaces and Digital Analytics Concept
Digital Financial Data Display with Charts and Graphs
Global Business Data Interface with Marketplace Analytics
Premium
A detailed shot of molecular models and chemical equations on a whiteboard, with a scientist in the background conducting an experiment
Abstract Business Data Analytics and Statistics Visualization
Mathematical Equations and Statistics on Black Background
Global Data Visualization with Charts and World Map Elements
Dynamic Financial Data Analytics with Global Connections
Premium
Displaying large vertical bar chart occupying center on green dashboard, showing globes, equations
High-Tech Data Visualization with Futuristic Graphs
Digital Data Visualization Financial Charts and Connections
Global Financial Data Chart and Graph Analysis Background
Complex Financial Data Visualizations Over Dark Background
Premium
Chemistry-Themed Background with Molecules, Equations, and Lab Equipment – Scientific Design for Presentations
Mathematical Equations and Data Processing Background
Digital Data Analytics with Interactive Charts and Global Visualization
Futuristic Data Analytics Interface Over Cityscape Background
Visual Analytics and Big Data Shaping Global Business Decisions
Premium
Digital chemical formulas and test tubes on dark background, education concept. 3D Rendering
Futuristic Data Interface with Graphs and Coding Elements
Analyzing Financial Dashboard with Pie, Bar and Line Charts on Dark Futuristic Interface
Innovative Digital Analytics Interface with Global Data Visualization
Digital Financial Data and Global Analytics Interface
Digital Data Interface with Charts and Text Analysis
Data Analysis Dashboard Overlaid on Night City Traffic Background
Premium
An extensive collection of varied mathematical symbols tailored for educational and creative design uses, perfect for enriching visual presentations and fostering innovative thought in diverse fields.
Digital Interface and Data Visualization Concept
Futuristic Infographic Analysis with Abstract Pattern Hologram
Digital Data Analysis with Graphs and Analytics Tools
Concept of Digital Data Processing and Online Security
Premium
Student or teacher touching mathematical and scientific concepts
Futuristic Digital Interface with Data Analytics Display
Digital Financial Data Analysis and Graphical Mindset
Digital Display of Global Financial Data Processing
Digital Financial Data and Analytics Interface on Red Background
Premium
a black background with a colorful diagram of the different types of wine, chemical equation background illustrating reactions
Digital Business Data Processing with Graph and Map Visualizations
Digital Financial Analysis with Mathematical Equations
Innovative Digital Data Analysis Interface
Abstract Statistical Analysis Data with Mathematical Formulas
Premium
Displaying world map outline hovering over grid, with equations, pixel clusters and data icons
Futuristic Data Analytics Overlay on Dark Background
Digital Global Analytics Interface with Infographics and Data Visualization
Global Data Visualization with Interactive Graphs and Charts on Dark Interface
Global Financial Data Visualizations with Charts and World Map
Premium
Abstract scientific formula hologram on empty classroom background. Multiexposure
Financial Data Processing Interface on Black Background
Global Financial Data Visualization with World Map and Charts
Digital Financial Data Visualizations with Thumbs Up Icons
Futuristic Virtual Data Dashboard with Analytics Interface Visualization
Premium
Abstract scientific formula hologram on office buildings background. Multiexposure
Corporate analytics dashboard displaying global map, dual pie charts and financial data