
- Home >
- Stock Photos >
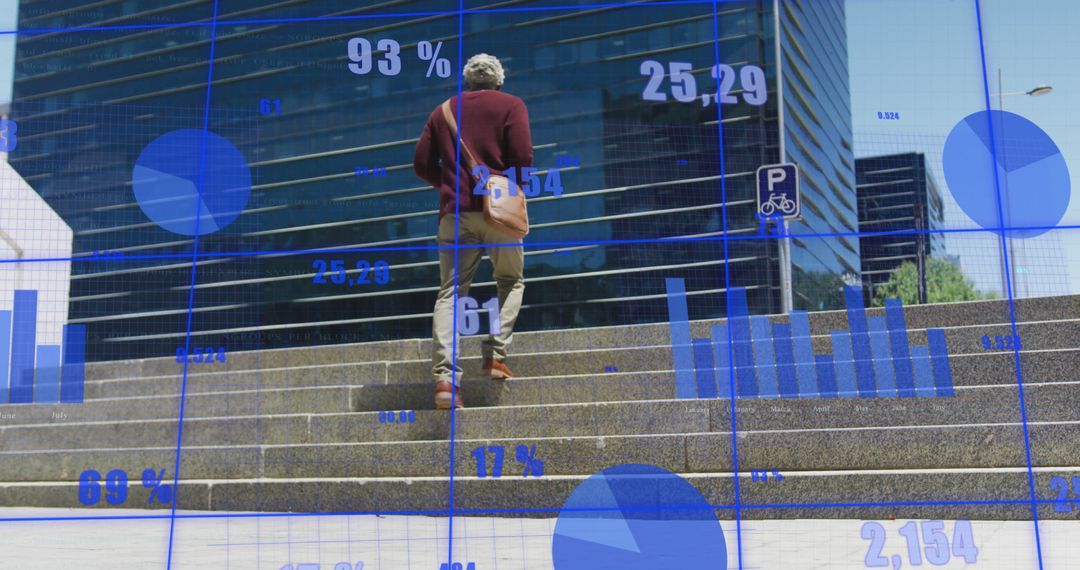
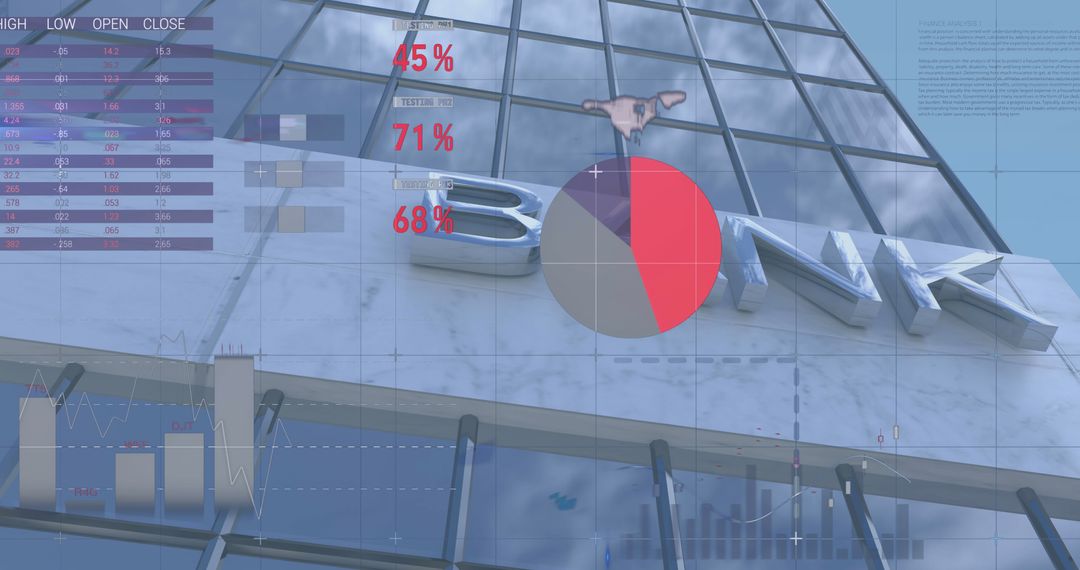
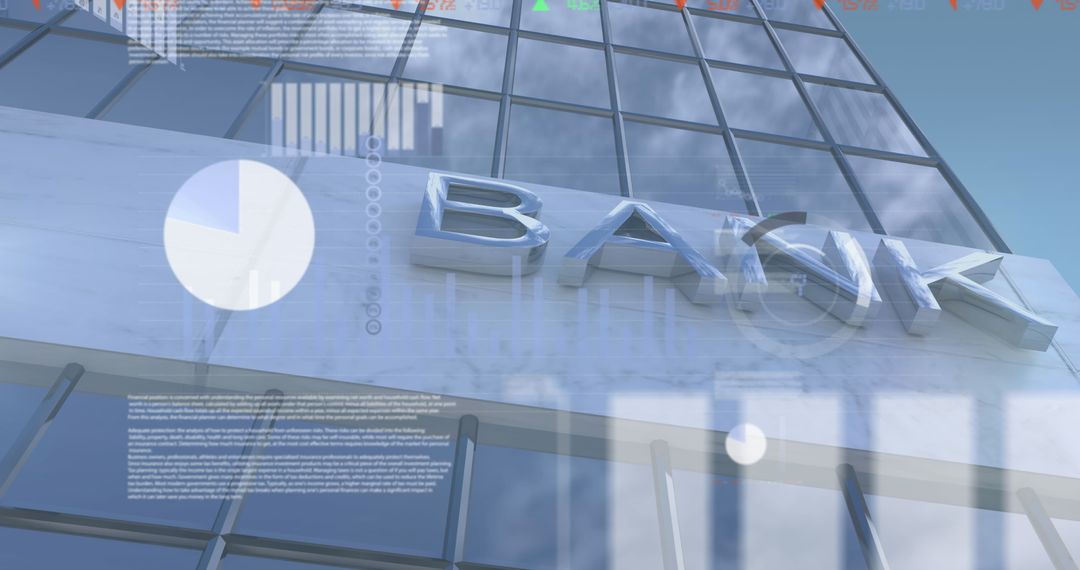
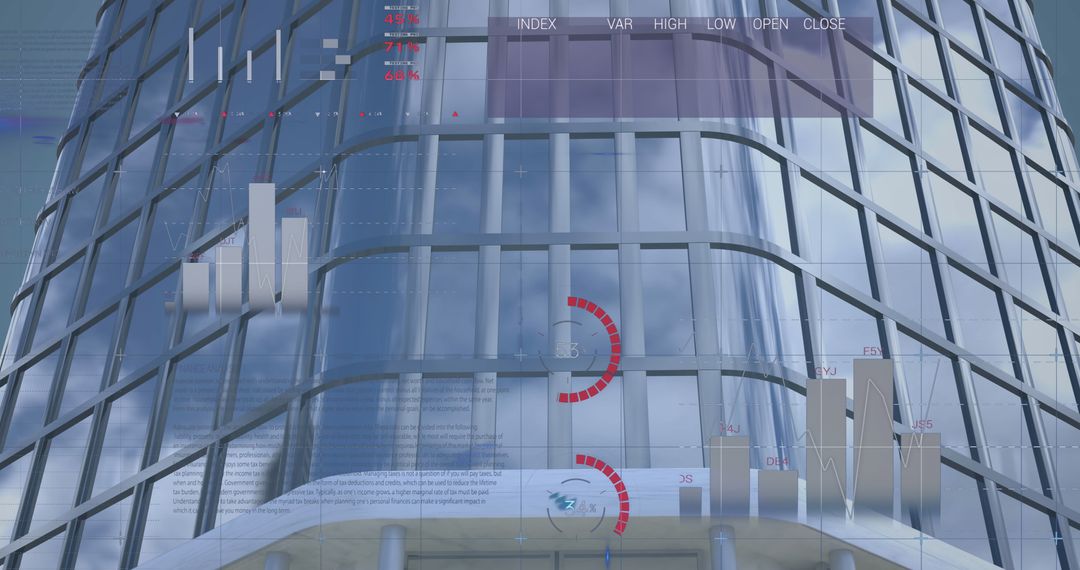
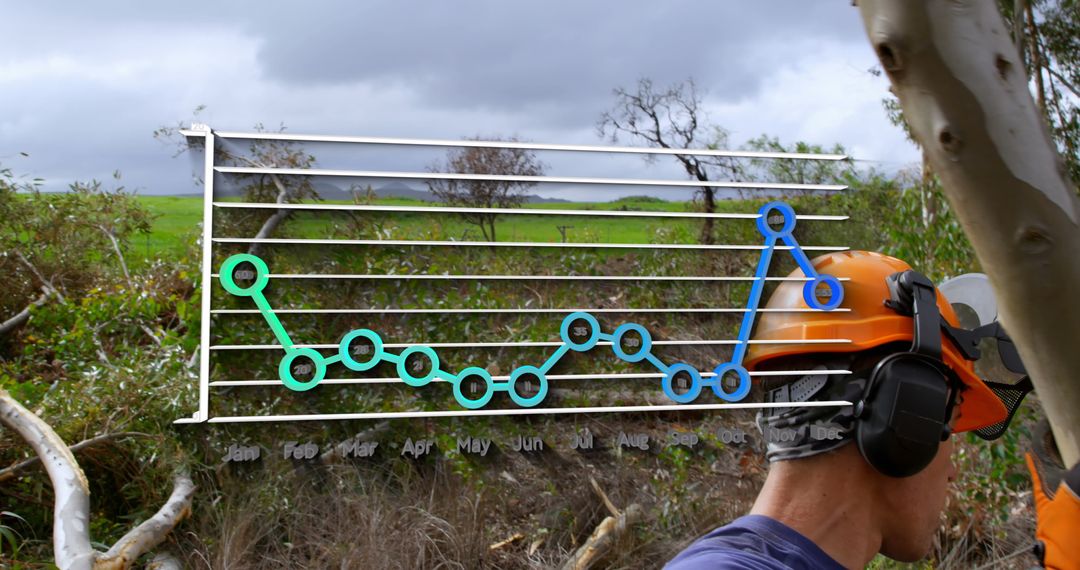
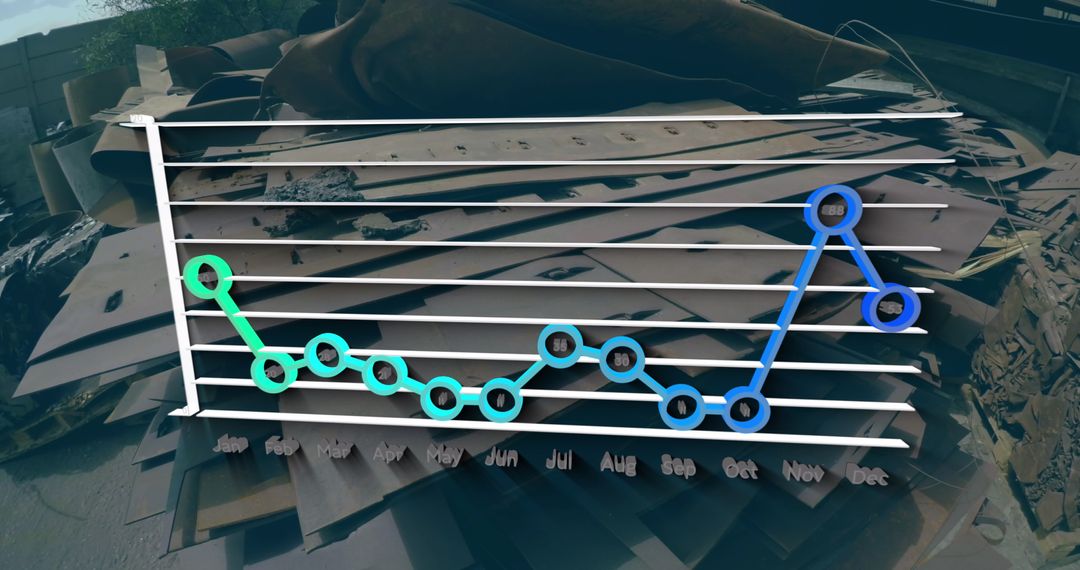
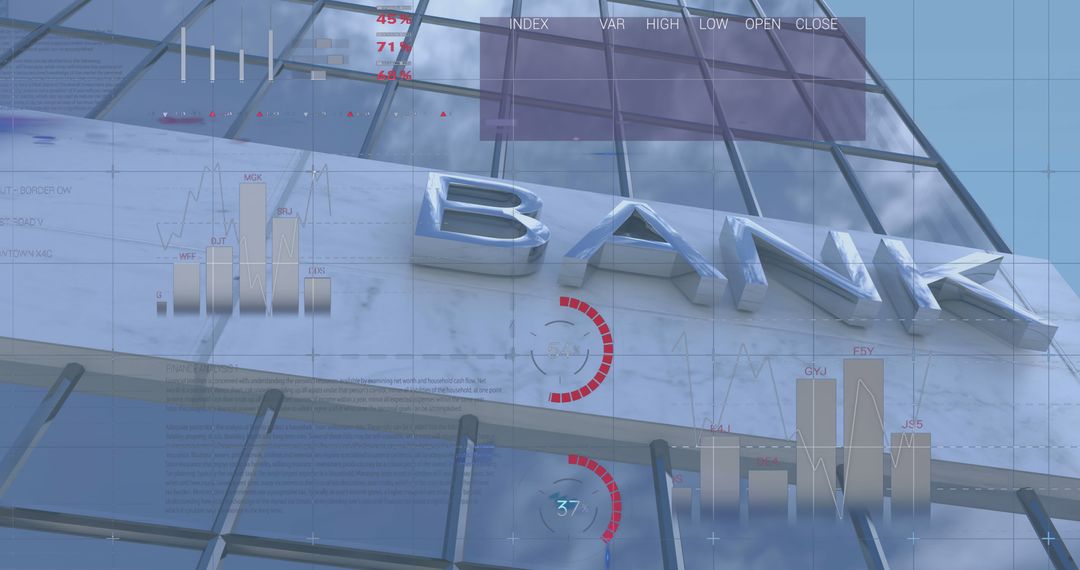
- Abstract Line Graph on Modern Office Building Background
Abstract Line Graph on Modern Office Building Background Image

Line graph with abstract design overlays glass facade of modern office building. Ideal for illustrating concepts in data analysis, economic trends, business growth, and technology advancements. Use for presentations, financial reports, or marketing materials focused on global commerce.
Powered by  - Get 15% off with code: PIKWIZARD15


4
downloads
downloads
Tags:
More
Credit Photo
If you would like to credit the Photo, here are some ways you can do so
Text Link
photo Link
<span class="text-link">
<span>
<a target="_blank" href=https://pikwizard.com/photo/abstract-line-graph-on-modern-office-building-background/e1bfb844b4d74b0f9defd438824533d4/>PikWizard</a>
</span>
</span>
<span class="image-link">
<span
style="margin: 0 0 20px 0; display: inline-block; vertical-align: middle; width: 100%;"
>
<a
target="_blank"
href="https://pikwizard.com/photo/abstract-line-graph-on-modern-office-building-background/e1bfb844b4d74b0f9defd438824533d4/"
style="text-decoration: none; font-size: 10px; margin: 0;"
>
<img src="https://pikwizard.com/pw/medium/e1bfb844b4d74b0f9defd438824533d4.jpg" style="margin: 0; width: 100%;" alt="" />
<p style="font-size: 12px; margin: 0;">PikWizard</p>
</a>
</span>
</span>
Free (free of charge)
Free for personal and commercial use.
Author: Authentic Images
Similar Free Stock Images

Premium


Premium


Premium


Premium


Premium


Premium


Premium


Premium


Premium


Premium


Premium


Premium


Premium


Premium


Premium


Premium


Premium


Premium


Premium


Premium


Premium


Premium


Premium


Premium

