- Home >
- Stock Photos >
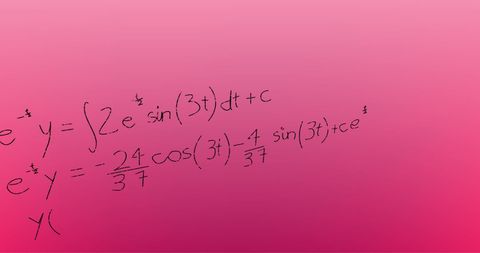
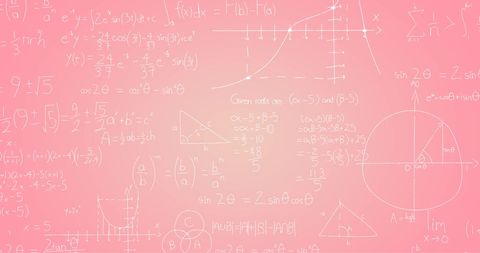
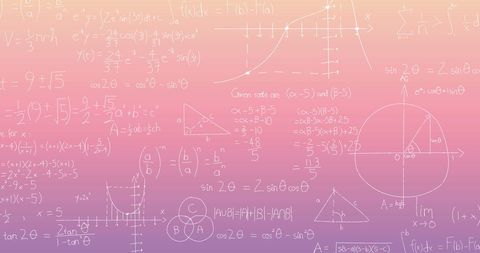
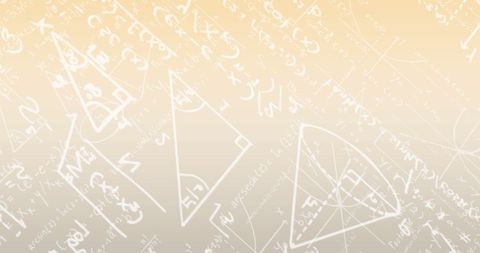
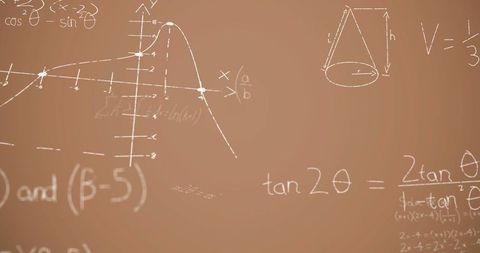
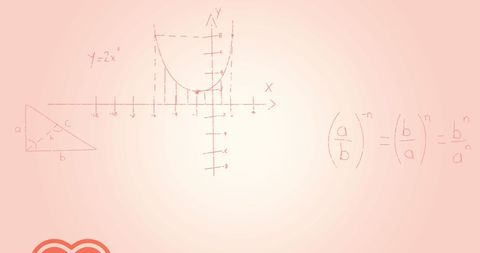
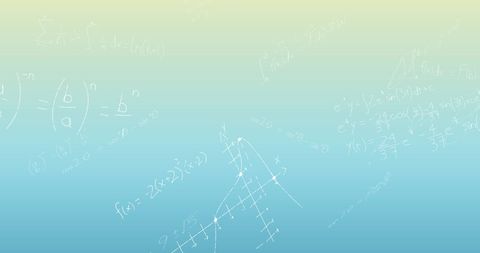
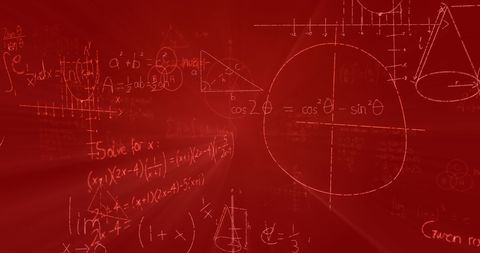
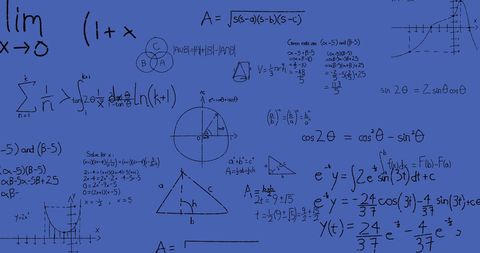
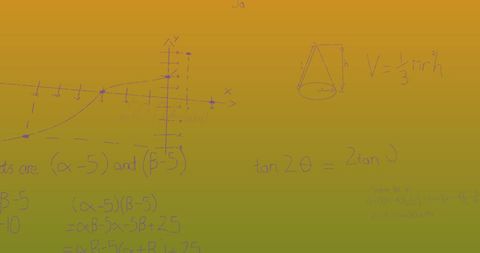
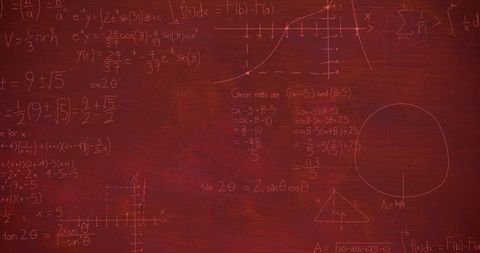
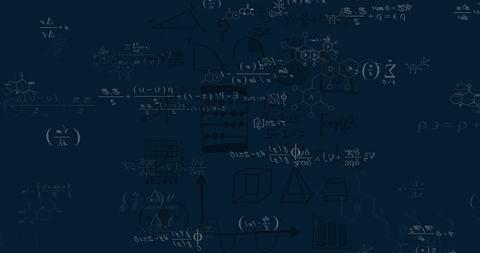
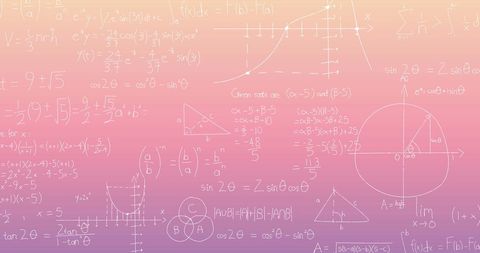
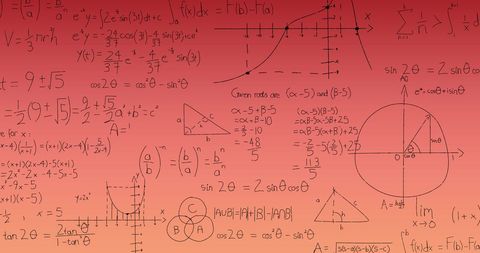
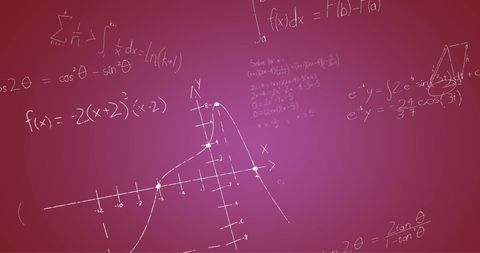
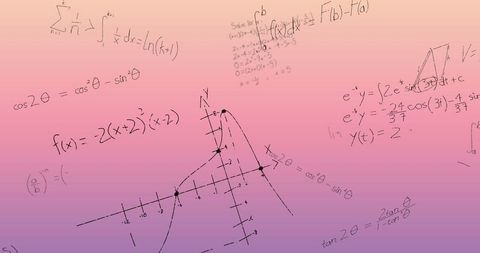
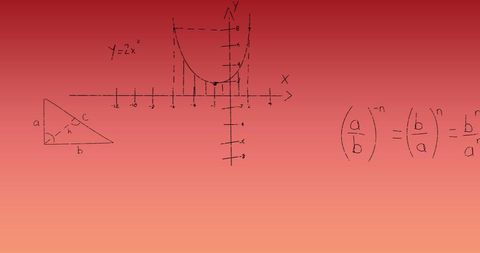
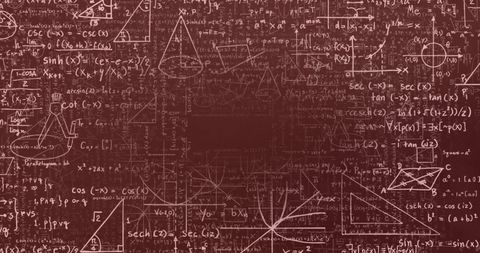
- Abstract Mathematical Formulae and Statistical Data Overlay
Abstract Mathematical Formulae and Statistical Data Overlay Image

This abstract visualization features an overlay of mathematical formulae combined with statistical graphs, creating a blend of scientific and analytical imagery. Ideal for illustrating the concepts of data analysis, scientific studies, educational materials, or innovative tech designs. Suitable for use in presentations, articles, and educational platforms focusing on mathematics, science, and technological innovations.

downloads
Tags:
More
Credit Photo
If you would like to credit the Photo, here are some ways you can do so
Text Link
photo Link
<span class="text-link">
<span>
<a target="_blank" href=https://pikwizard.com/photo/abstract-mathematical-formulae-and-statistical-data-overlay/c592a079d5b5f6862b1a05e4f6fec318/>PikWizard</a>
</span>
</span>
<span class="image-link">
<span
style="margin: 0 0 20px 0; display: inline-block; vertical-align: middle; width: 100%;"
>
<a
target="_blank"
href="https://pikwizard.com/photo/abstract-mathematical-formulae-and-statistical-data-overlay/c592a079d5b5f6862b1a05e4f6fec318/"
style="text-decoration: none; font-size: 10px; margin: 0;"
>
<img src="https://pikwizard.com/pw/medium/c592a079d5b5f6862b1a05e4f6fec318.jpg" style="margin: 0; width: 100%;" alt="" />
<p style="font-size: 12px; margin: 0;">PikWizard</p>
</a>
</span>
</span>
Free (free of charge)
Free for personal and commercial use.
Author: Authentic Images